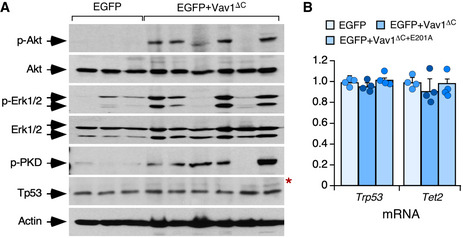
Figure EV4. Status of signal transduction pathways in Vav1ΔC‐transformed cells.

- Western blot showing the levels of phosphorylated and total proteins in spleen extracts from control and tumor‐bearing recipient mice that had been transplanted with the indicated retrovirally transduced CD4+ T cells (top). Total levels of Akt, Erk1/2, and actin were used as loading controls. The red asterisk indicates a panel that has been generated using an independent filter but the same tissue lysates.
- Abundance of indicated transcripts (bottom) in splenic cells from control (EGFP+), tumor‐bearing mice (expressing EGFP and Vav1ΔC), and mice transplanted with cells transduced with the catalytically dead version of Vav1ΔC (expressing EGFP and Vav1ΔC+E201A). Values are given relative to the expression of each transcript in samples obtained from EGFP controls (which was given an arbitrary value of 1). n = 4 animals per class analyzed. a.u., arbitrary unit. Data represent the mean ± SEM. Statistical values obtained using the Student’s t are given relative to control EGFP+ cells.
Source data are available online for this figure.
