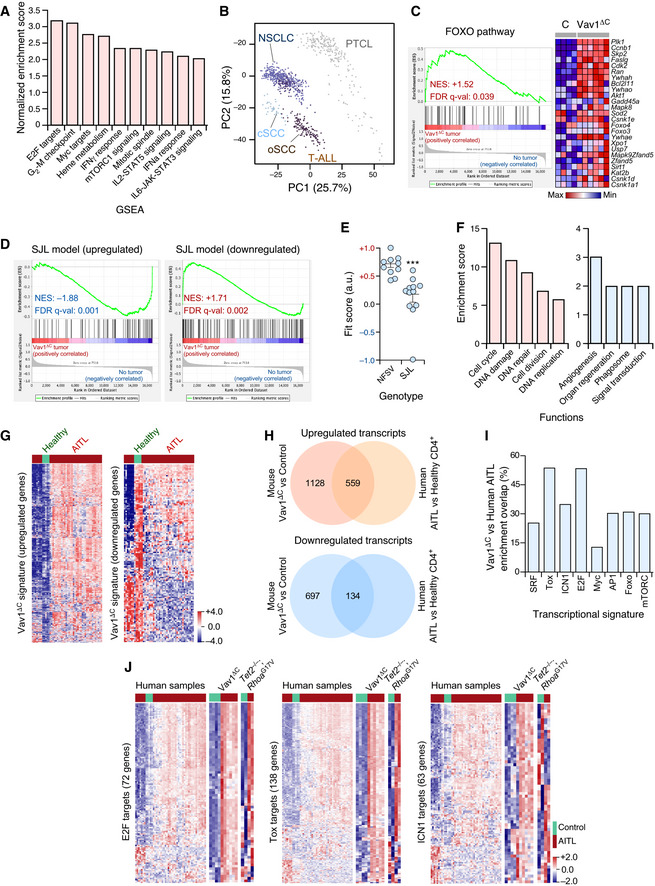
Main functional pathways upregulated in the Vav1ΔC‐dependent transcriptome according to unbiased GSEAs. For all of them, q‐val < 0.05.
Principal component analysis showing the enrichment of the Vav1ΔC‐dependent signature across the indicated tumor‐associated transcriptomes. cSCC, cutaneous squamous cell carcinoma; oSCC, oral squamous cell carcinoma; T‐ALL, T‐cell acute lymphoblastic leukemia.
GSEA for the Vav1ΔC‐tumor gene expression matrix using as gene set the differentially expressed genes by the FOXO pathway. The expression profile of the top 25 leading‐edge genes in the transcriptome of CD4+ T cells from healthy and Vav1ΔC tumor‐bearing mice is shown. The normalized enrichment scores (NES) and false discovery rate values (FDR, using q values) are indicated inside the GSEA graph. Relative changes in abundance are shown in color gradients according to the color scale shown at the bottom. q‐val, q value.
GSEAs for the Vav1ΔC‐tumor gene expression matrix using as gene set the differentially expressed genes by the SJL mouse model. The NES and FDR (using q values) are indicated inside the GSEA graph as in C. q‐val, q value.
Dot plot of the Vav1ΔC‐dependent gene signature fit score in the indicated experimental groups (bottom). Dots represent values from an individual sample. Bars represent the mean enrichment value ± SEM for the overall sample set. ***P ≤ 0.001 (according to Tukey’s honest significance difference test).
Main functional categories encoded by the Vav1ΔC‐specific gene subset described in the main text. Up (red); down (blue). For all of categories, P ≤ 0.001 (Fisher’s exact test).
Fraction of the upregulated (left) and downregulated (right) Vav1ΔC‐driven transcriptome showing conservation with the expression programs identified in human AITL patients. Relative changes in abundance are shown in color gradients according to the color scale shown on the right. Healthy, CD4+ T cells from healthy patients (green box). AITL, human AITL (red color boxes).
Venn diagrams representing the number of up‐ (top) and downregulated (bottom) genes from the Vav1ΔC‐dependent transcriptome that are shared with the AITL patient dataset used in panel G.
Enrichment of indicated Vav1ΔC‐driven gene signatures that are shared with the AITL patient dataset used in panel G.
Heatmaps showing the expression profiles of human and mouse differentially expressed genes (DEG) belonging to the indicated functional categories (indicated on the left of each panel). Each row represents 1 DEG identified in the indicated AITL models (top). Each column represents 1 sample. The number of genes of each functional category is indicated. Relative changes in abundance are shown in color gradients according to the color scale shown on the bottom right. Green boxes, healthy individuals (in the case of human data), and WT mice. Red boxes, AITL samples from either patients or the indicated mouse models.

