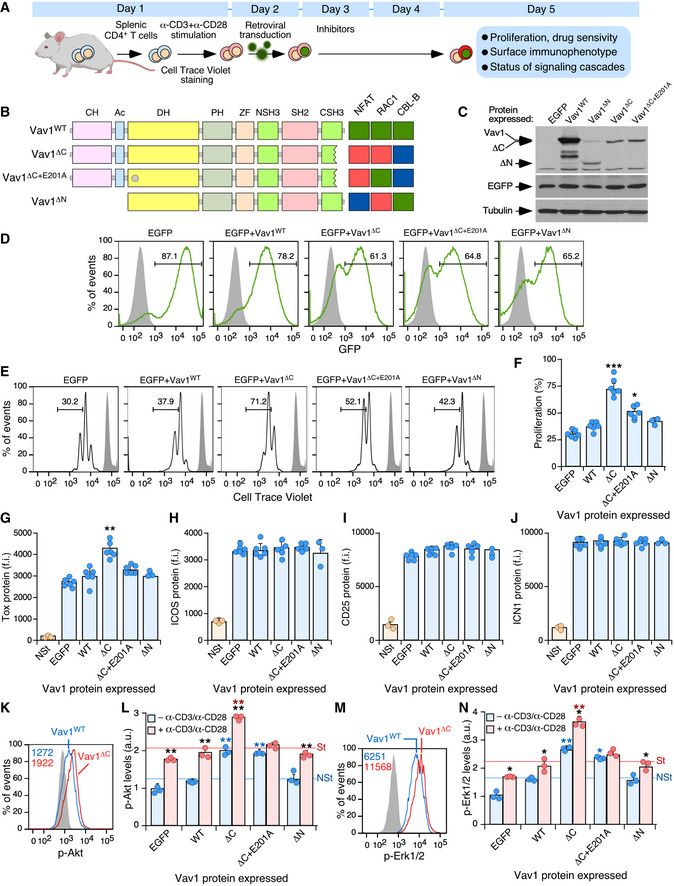
Figure 6. Vav1ΔC‐mediated proliferation requires engagement of several downstream pathways.

-
ASchematic representation of the experiments used in this figure. See details in main text and Materials and Methods.
-
BDepiction of the Vav1 mutants used in these experiments. The E201A mutation is shown as a gray circle. The activity of each mutant is represented on the right. Green box, WT activity; red box, gain of function; blue box, loss of function.
-
CRepresentative immunoblot showing the abundance of the ectopic Vav1 proteins, EGFP, and the endogenous tubulin α (loading control) in CD4+ T cells transduced with retrovirus particles used in these experiments (top).
-
DRepresentative FACS plots showing EGFP epifluorescence in CD4+ T cells transduced with retroviruses encoding the indicated proteins (top). Numbers indicate the relative percentage (%) of the EGFP+ cell population in each case. Gray shaded histograms represent the fluorescence obtained from CD4+ T cells nontransduced with retrovirus particles. Similar results were obtained in CD4+ T cells transduced with virus encoding EGFP (n = 6), Vav1WT (n = 6), Vav1ΔC (n = 6), Vav1ΔC+E201A (n = 6), and Vav1ΔN (n = 3).
-
E, FRepresentative FACS plots (E) and quantification (F) of the proliferation of EGFP+ CD4+ T cells expressing the indicated proteins using the Cell Trace Violet method. In (E), the gray shaded histograms represent the fluorescence obtained from nonstimulated CD4+ T cells before stimulation and retroviral transduction. In (F), each point represents the values obtained with a single experimental mouse. n = 6 per each experimental condition, except in the case of Vav1ΔN (n = 3).
-
G–JFlow cytometry determination of Tox (G), ICOS (H), CD25 (I), and ICN1 (J) expression in EGFP+ CD4+ T cells expressing the indicated Vav1 proteins. NSt, nonstimulated cells (CD4+ T cells before stimulation and retroviral transduction). In all panels, each point represents the values obtained for a single experimental condition. f.i., mean fluorescence intensity relative to the isotype‐matched control antibody. n = 6 per each experimental condition, except for the Vav1ΔN and NSt conditions (n = 3).
-
K–NExample of a flow cytometry analysis (K and M) and final quantification of p‐Akt (L) and p‐Erk1/2 (N) levels in EGFP+ CD4+ T cells expressing the indicated Vav1 proteins in primed (blue bars) and restimulated (red bars) cells. In K and M, the gray shaded histograms represent the fluorescence obtained with the isotype‐matched control antibody. In L and N, NSt, nonstimulated, St, stimulated. n = 3 per each experimental condition.
Data information: In panels (F, G, H, I, J, L, and N), values are shown as means ± SEM from three independent experiments. In panels L and N, P‐values are given relative to nonstimulated (blue asterisks) and stimulated (red asterisks) cells expressing Vav1WT. We also included P‐values for the values exhibited by each Vav1 mutant protein relative to those obtained in nonstimulated condition (black asterisks). *P ≤ 0.05; **P ≤ 0.01; ***P ≤ 0.001 (Student’s t‐test).
Source data are available online for this figure.
