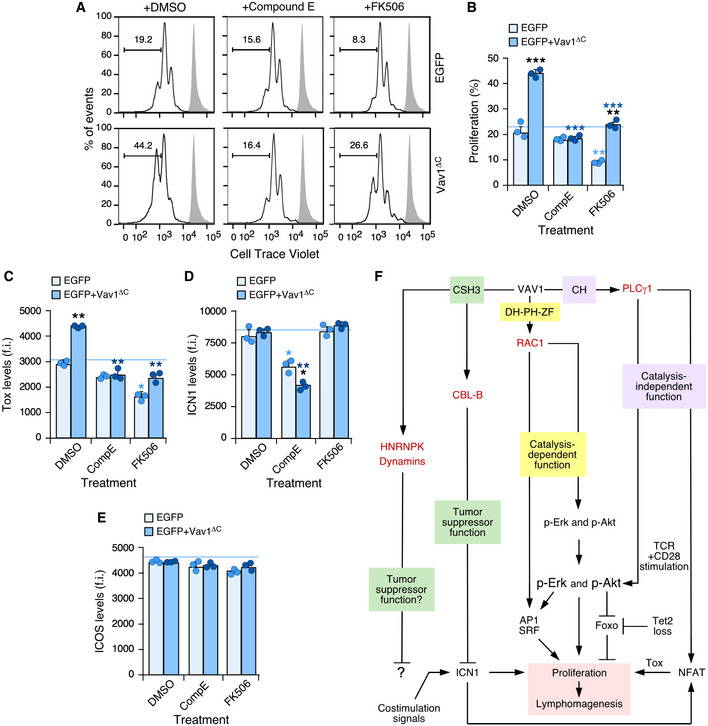
Figure 7. Vav1ΔC‐driven CD4+ T‐cell proliferation requires ICN1 and proper calcineurin signaling.

-
A, BRepresentative FACS plots (A) and quantification (B) of the EGFP+ CD4+ T‐cell proliferation in the different experimental groups (right) and indicated experimental conditions (top) using the Cell Trace Violet detection method. In A, gray shaded histograms represent the fluorescence obtained from nonstimulated CD4+ T cells before stimulation and retroviral transduction. n = 3 independent experiments.
-
C–EFlow cytometry determination of intracellular Tox (C), intracellular ICN1 (D), and surface ICOS (E) levels in EGFP+ CD4+ T cells expressing the indicated Vav1 proteins. f.i., mean fluorescence intensity relative to the isotype‐matched control antibody. n = 3 independent experiments.
-
FSummary of the Vav1‐regulated signaling pathways that contribute to promote the proliferation of primary CD4+ T cells that have been unveiled in this work. The other downstream effectors and pathways of Vav1 are indicated. The main primary effectors as shown in red.
Data information: In panels (B, C, D, and E), values are shown as means ± SEM from three independent experiments. P‐values are given relative to nontreated (light blue asterisks) and treated (dark blue asterisks) EGFP+ cells. We also include P‐values for the values exhibited by each experimental group relative to those obtained in nontreated condition (black asterisks). *P ≤ 0.05; **P ≤ 0.01; ***P ≤ 0.001 (Mann–Whitney U‐test).
Source data are available online for this figure.
