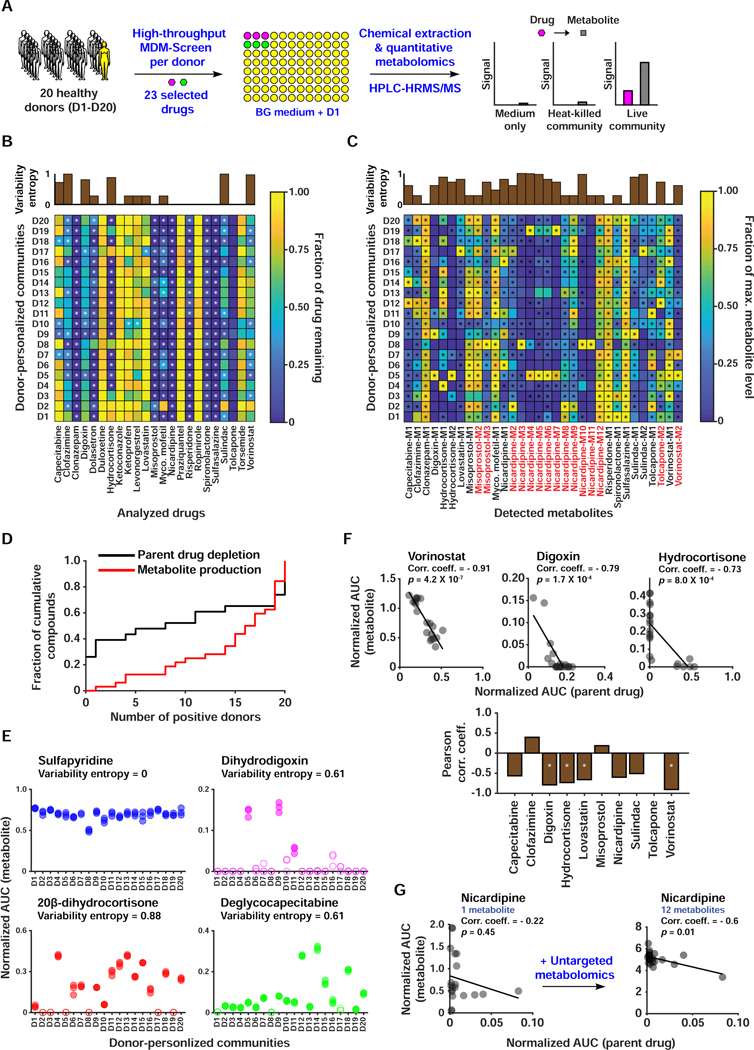
Figure 4. A HT, quantitative metabolomic approach to assess inter-individual variability in MDM using personalized microbial communities.
A) Schematic representation of quantitative MDM-Screen with 20 donors and 23 selected drugs. B) Heat map of drug depletion showing the mean fraction of drug remaining after 24 hours for each donor-drug combination. The fraction remaining is computed relative to the medium-drug control, and fractions above 1 are truncated to 1 for simplicity. C) Heat map of metabolite production showing the mean level of metabolite after 24 hours, normalized to the maximum level of that metabolite across all donors. Metabolites in red were discovered using the untargeted metabolomics approach, while ones in black were discovered previously or by MDM-Screen with the PD microbiome (Table S3B). In B and C, “*” indicates statistically significant metabolism in the donor condition as compared to controls. The upper inset axes represent inter-individual variability in MDM using the Shannon entropy (calculated in base 2) of the distribution of donors with significant and non-significant metabolism. D) Cumulative histogram of the number of significant donors for both metabolite production and parent drug depletion. For parent drugs, the y-axis is normalized to the total number of drugs tested (23), and for metabolite production, it is normalized to the total number of metabolites produced (32). Levels of metabolite production (measured by HPLC-HRMS in AUC normalized to an internal standard) for four drugs, with the variability entropy indicated above. Filled data points indicate that the replicates are significantly higher than control conditions, while hollow data points indicate that they are not. F) The upper three scatter plots show significant negative correlation between drug depletion and metabolite production, with the Pearson correlation coefficient indicated above. The line shown is a linear regression fit of the data. The lower bar plot indicates the Pearson correlation coefficient between remaining drug levels and total metabolite production for all computed cases. ‘*’ indicates an FDR corrected two-sided t-test p < 0.01. For drugs with multiple metabolites, we sum the normalized AUC of all metabolites. G) Correlation between drug depletion and metabolite production for nicardipine before and after inclusion of metabolites discovered by untargeted metabolomics. See also Table S3.

