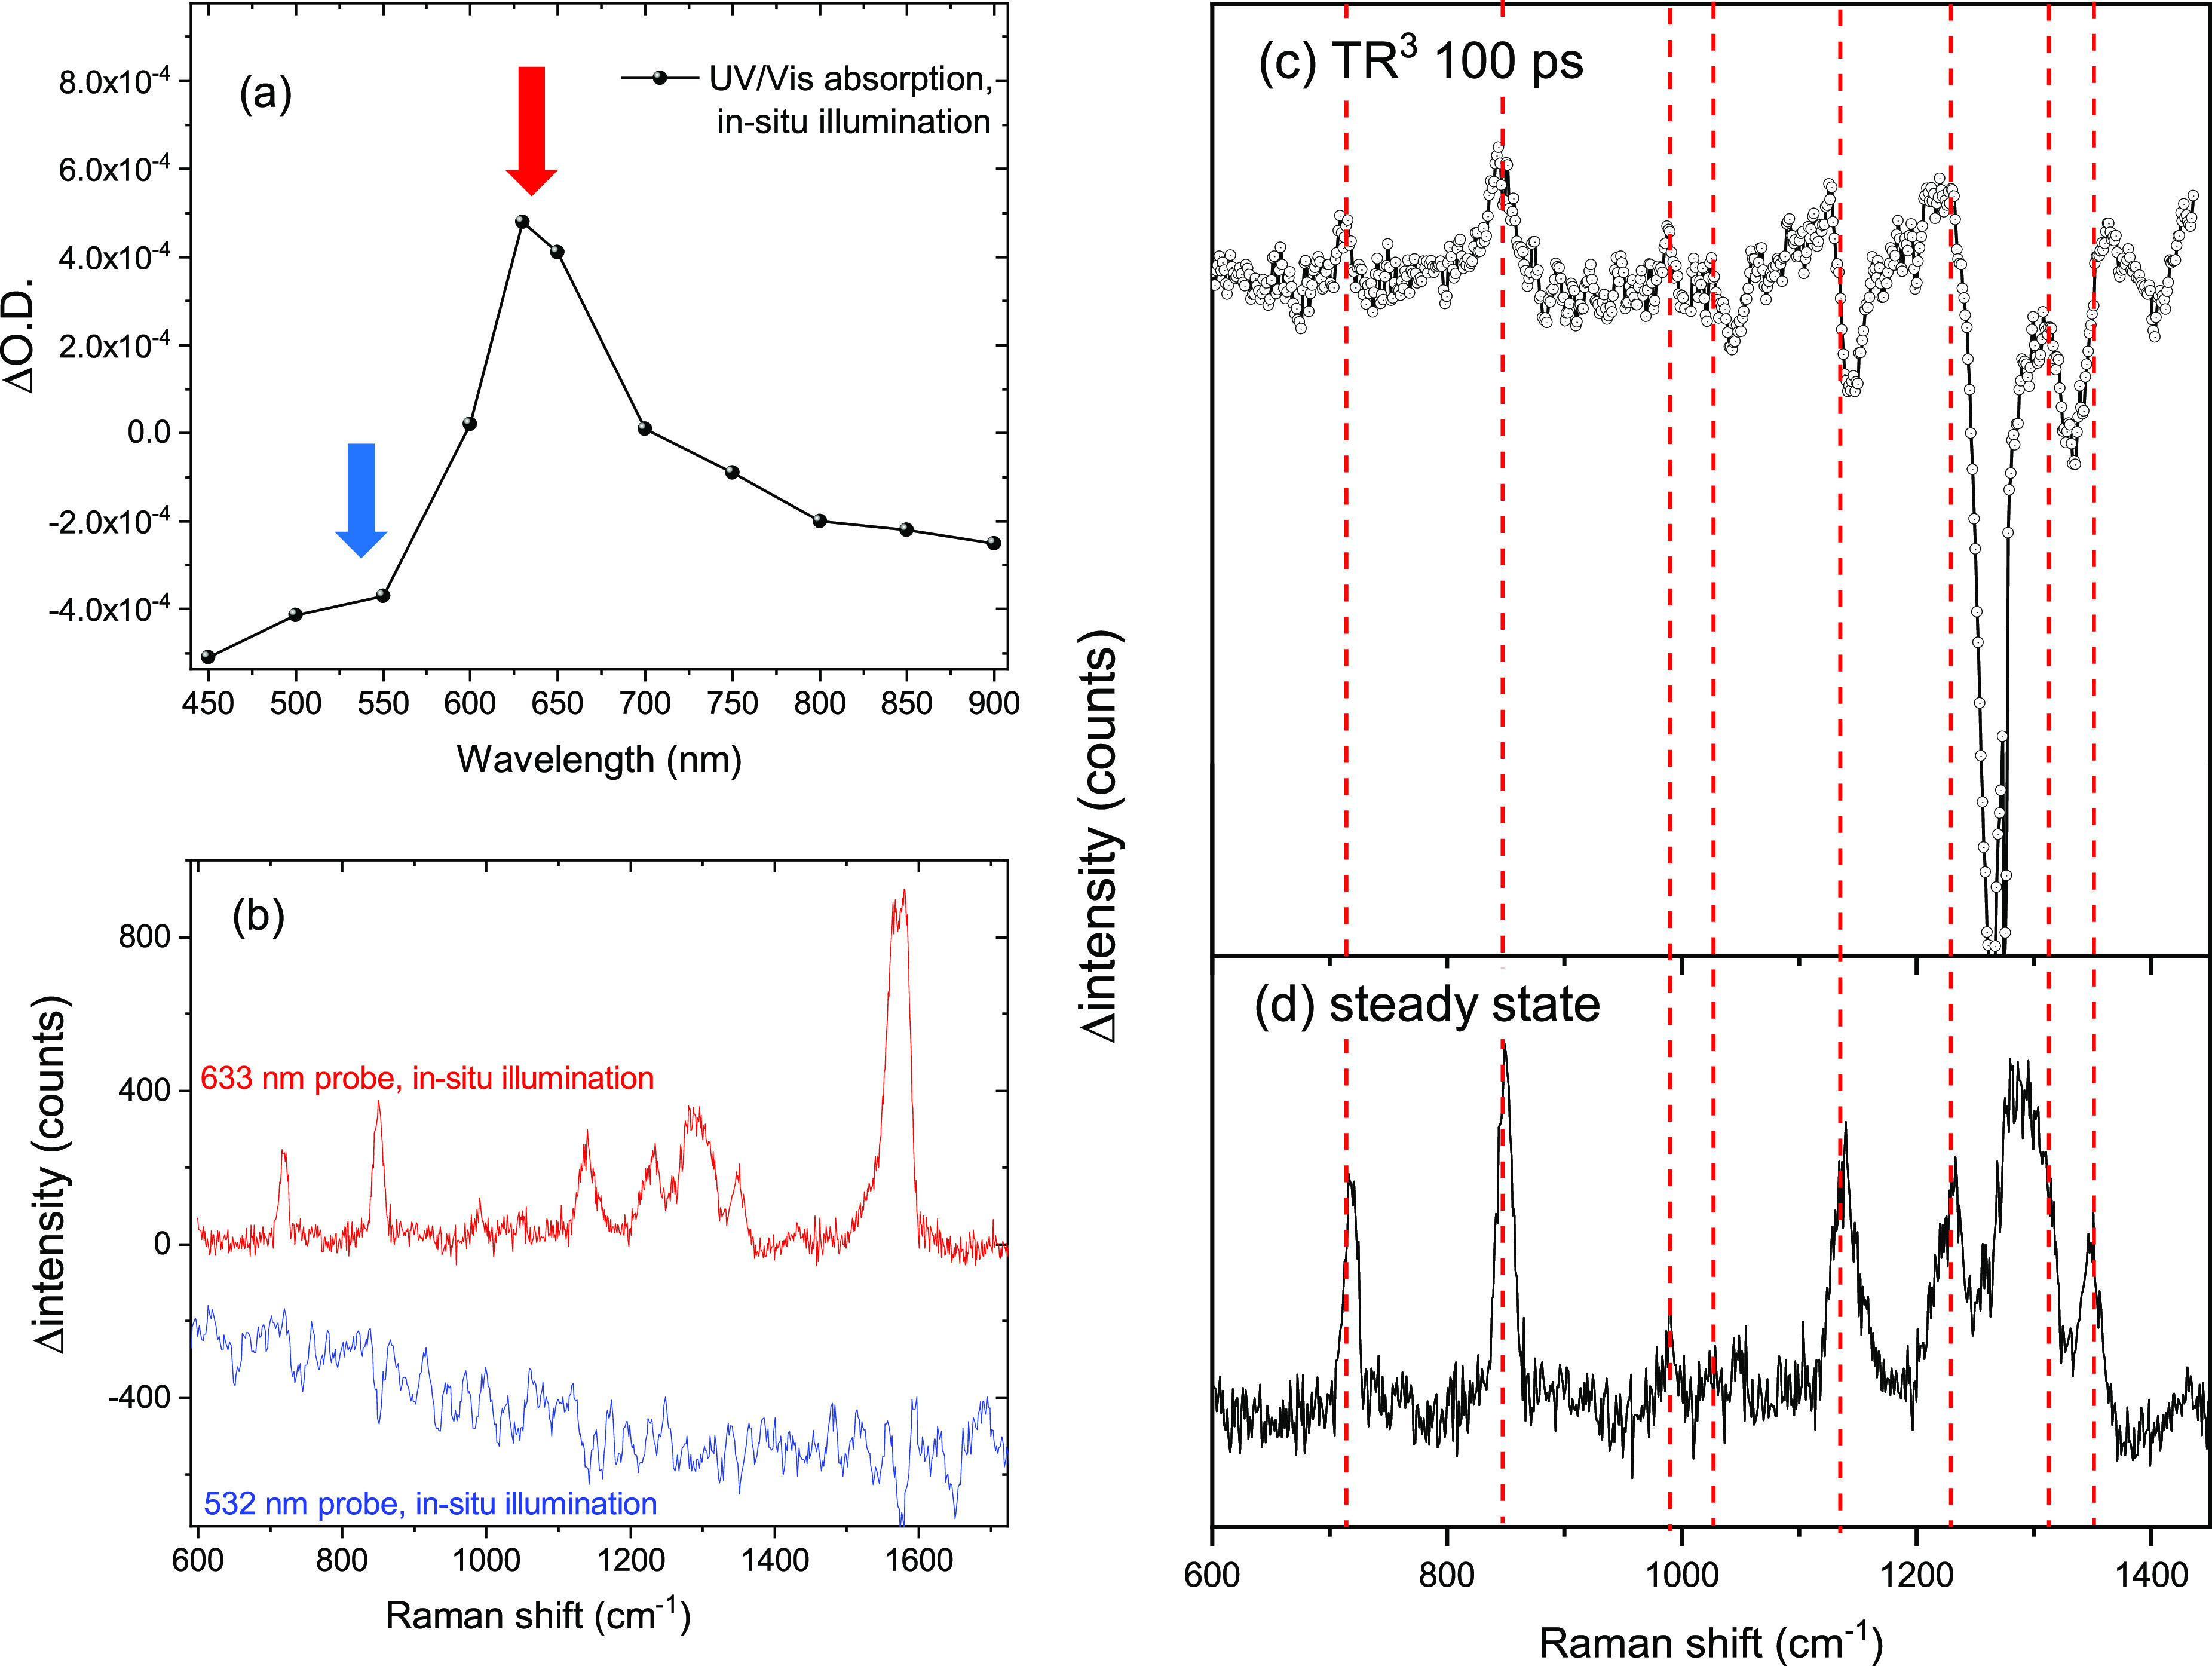
Figure 2.

(a) UV–vis spectrum of P10(e–) generated by CW 365 nm illumination of P10 in the presence of TEA/methanol/water (1:1:1). The red and blue arrows indicate the Raman probe wavelengths used in (b). (b) Raman difference spectrum (using the sample in the dark as a background) of P10 in the presence of TEA/methanol/water (1:1:1) on and off resonance with the observed feature in the UV–vis spectrum. (c, d) Comparison between the steady state (d) and TR3 Raman data (c, 100 ps) which show the presence of the same species.
