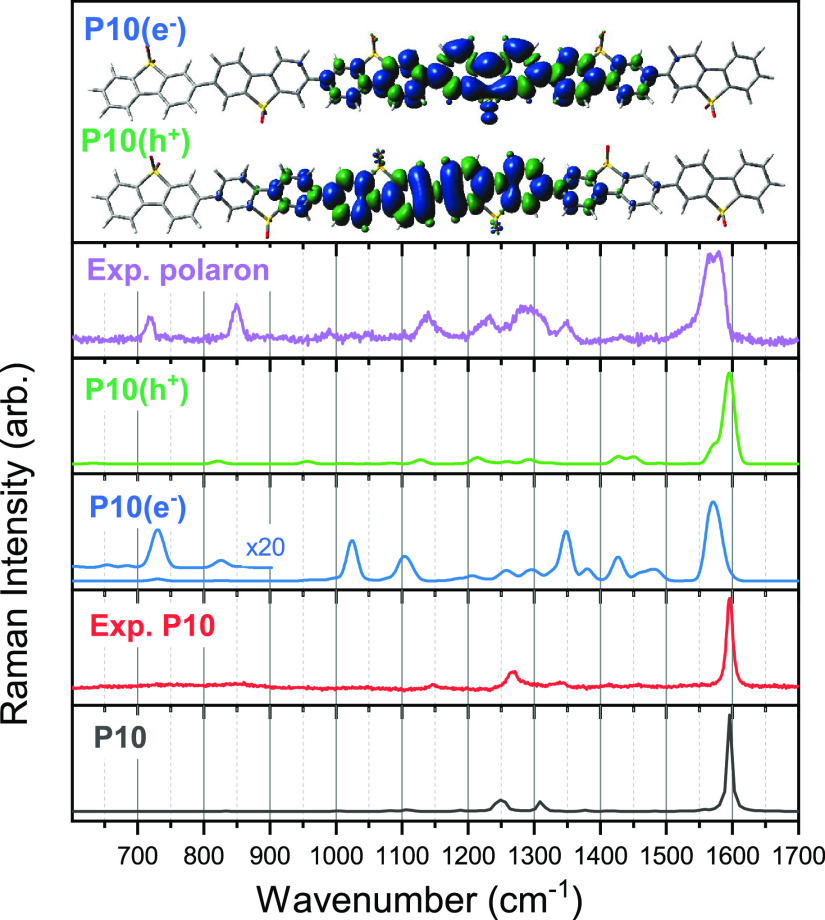
Figure 3.
Comparison of the experimental spectra of P10 and the P10 polaron to the predicted (pre)resonance (ωB97XD/cc-pVDZ) spectra of a P10 hexamer in different charge states. All predicted spectra have been scaled by a factor of 0.943, obtained by aligning the intense peak in the predicted neutral spectrum to that of the P10 experimental spectrum. The predicted resonance Raman spectra shown for P10(e–) and P10(h+) are calculated for the intermediate excited state with a predicted vertical absorption closest to 630 nm. Similar spectra for other intermediate excited states can be found in Figure S10. The inset is a schematic of the polaron localization for the two charged species.

