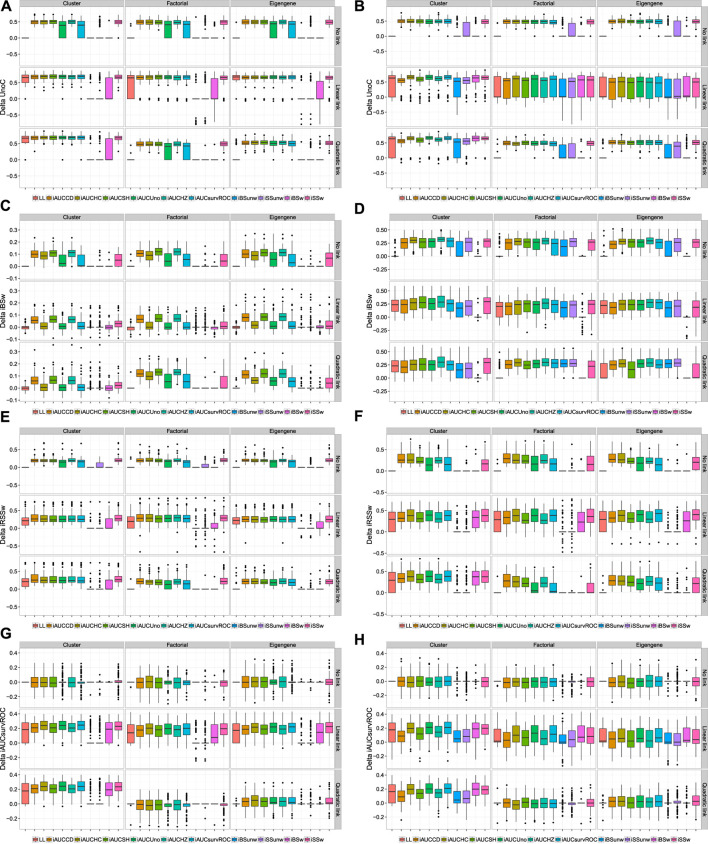
FIGURE 3.
Panel by performance measure (row) and models (columns) displaying the deltas between the performance achieved for any CV crit − the performance achieved for vHCVLL. Top: Δ of UnoC. panel (A): PLS−Cox. panel (B): sPLSDR. Row 2: Δ of iBSW. panel (C): PLSDR. panel (D): DKsPLSDR. Row 3: Δ of iRSSW. panel (E): autoPLS−Cox. panel (F): PLSDR. Bottom: Δ of iAUCSurvROC. panel (G): PLSDR. panel (H): sPLSDR.

