
Figure 1. Identification of replication origins.
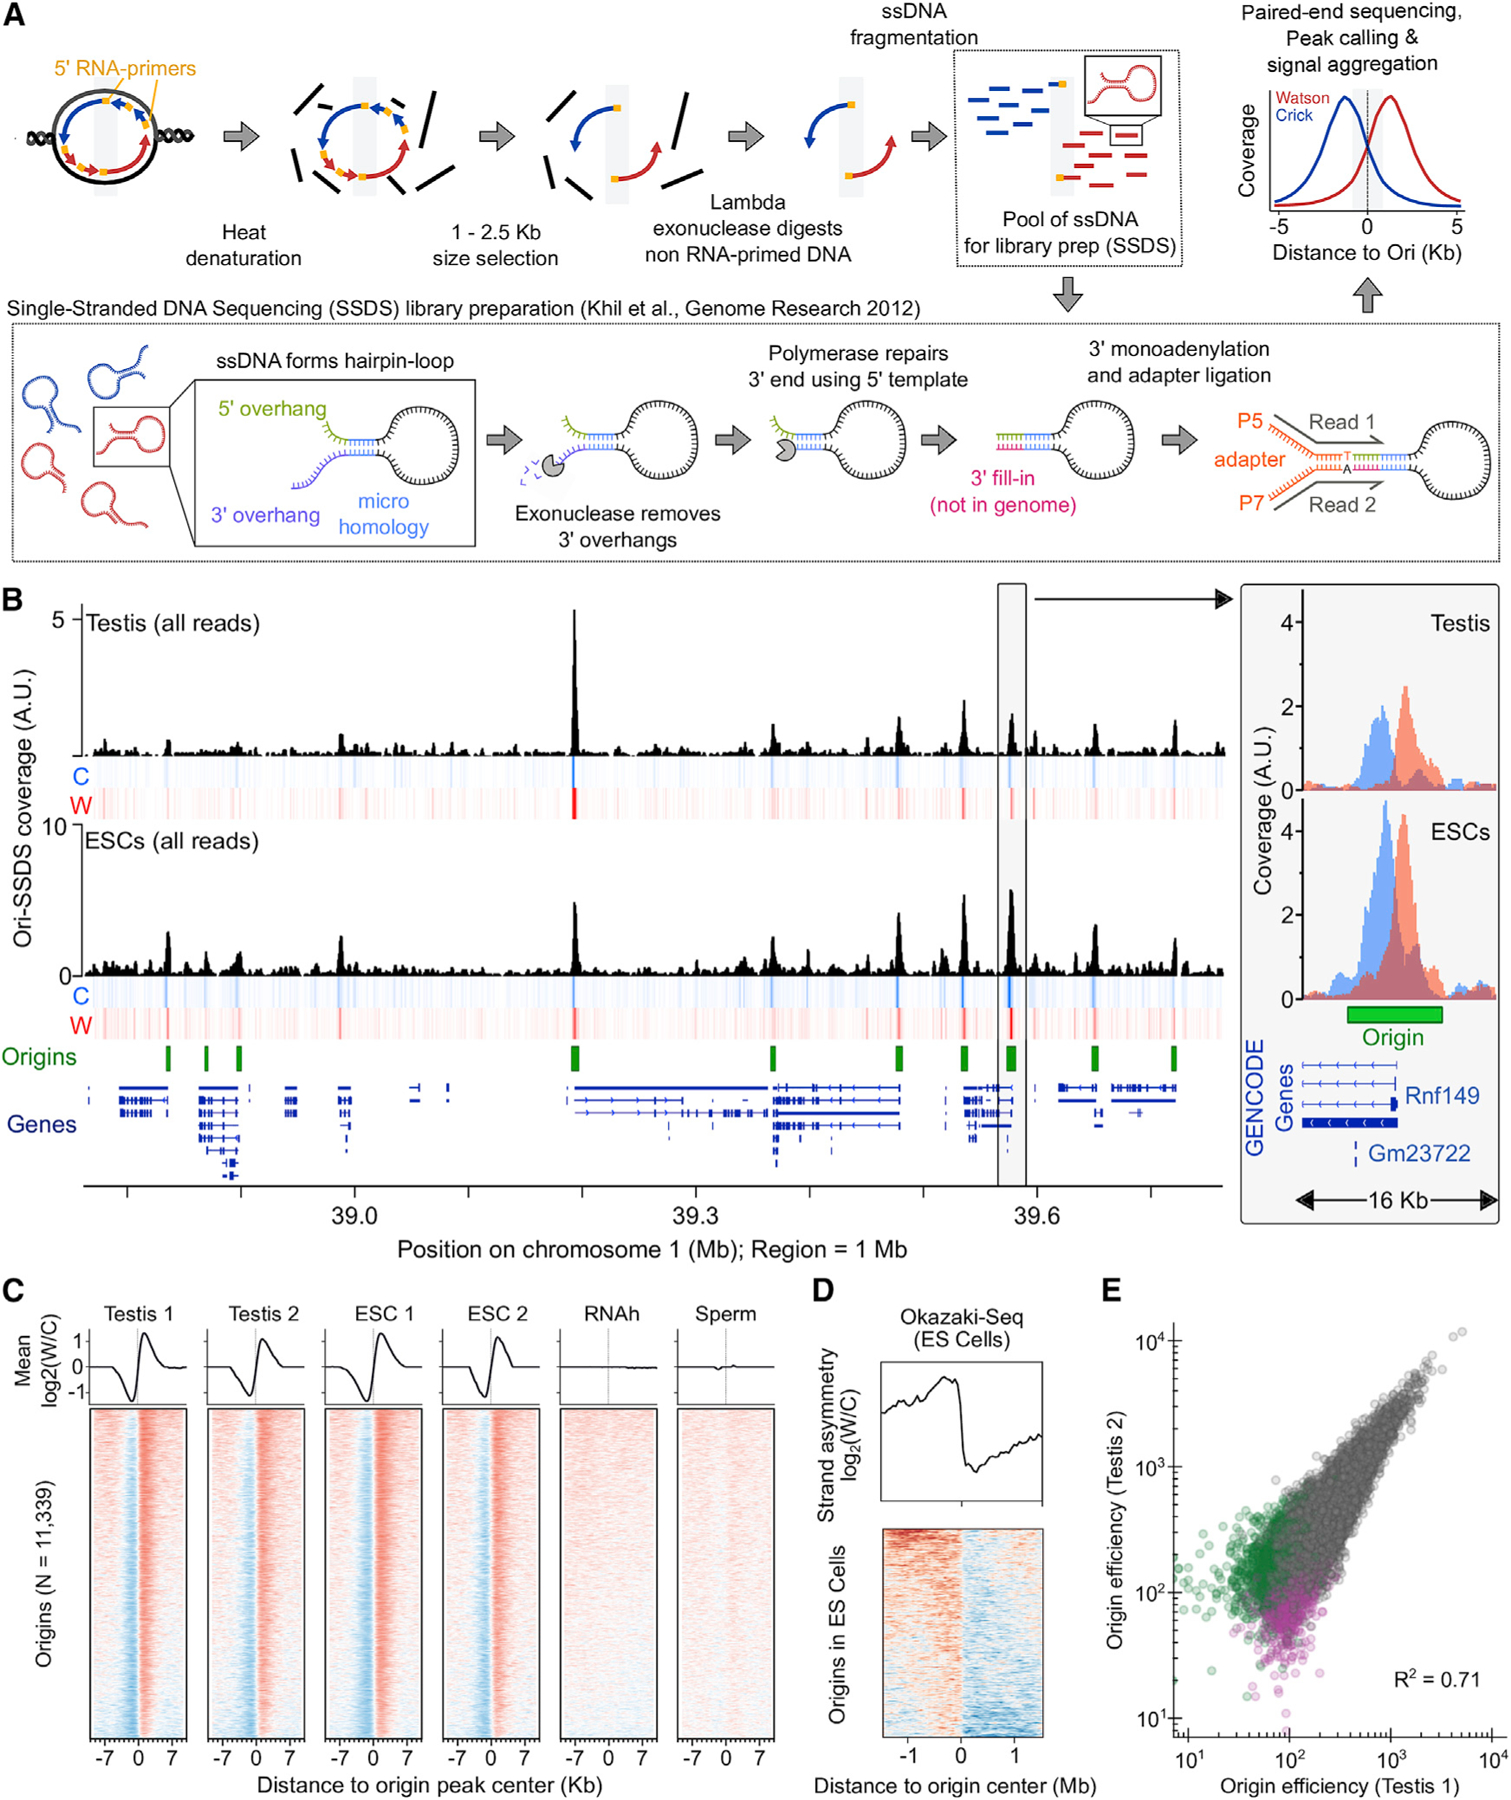
(A) Schematic of the Ori-SSDS protocol to sequence nascent leading strands.
(B) The Ori-SSDS signal in a typical 1 Mb region (black, total coverage; heatmap shows coverage by strand: red, Watson; blue, Crick; 1 kb windows, 147 bp step). Inset: zoom of a typical peak.
(C) Characteristic, reproducible Watson-Crick asymmetry at origins is lost in controls. The log2 ratio of Watson/Crick ssDNA fragments is shown (1 kb smoothing).
(D) Ori-SSDS peaks coincide with a switch in the direction of lagging-strand DNA synthesis (from Okazaki-fragment sequencing).
(E) Origin efficiency is highly correlated among replicates. Origins found only in one replicate are colored purple and green, respectively.
See also Figures S1 and S2 and Data S1.