
Figure 4. In silico modeling recapitulates RT from origin locations.
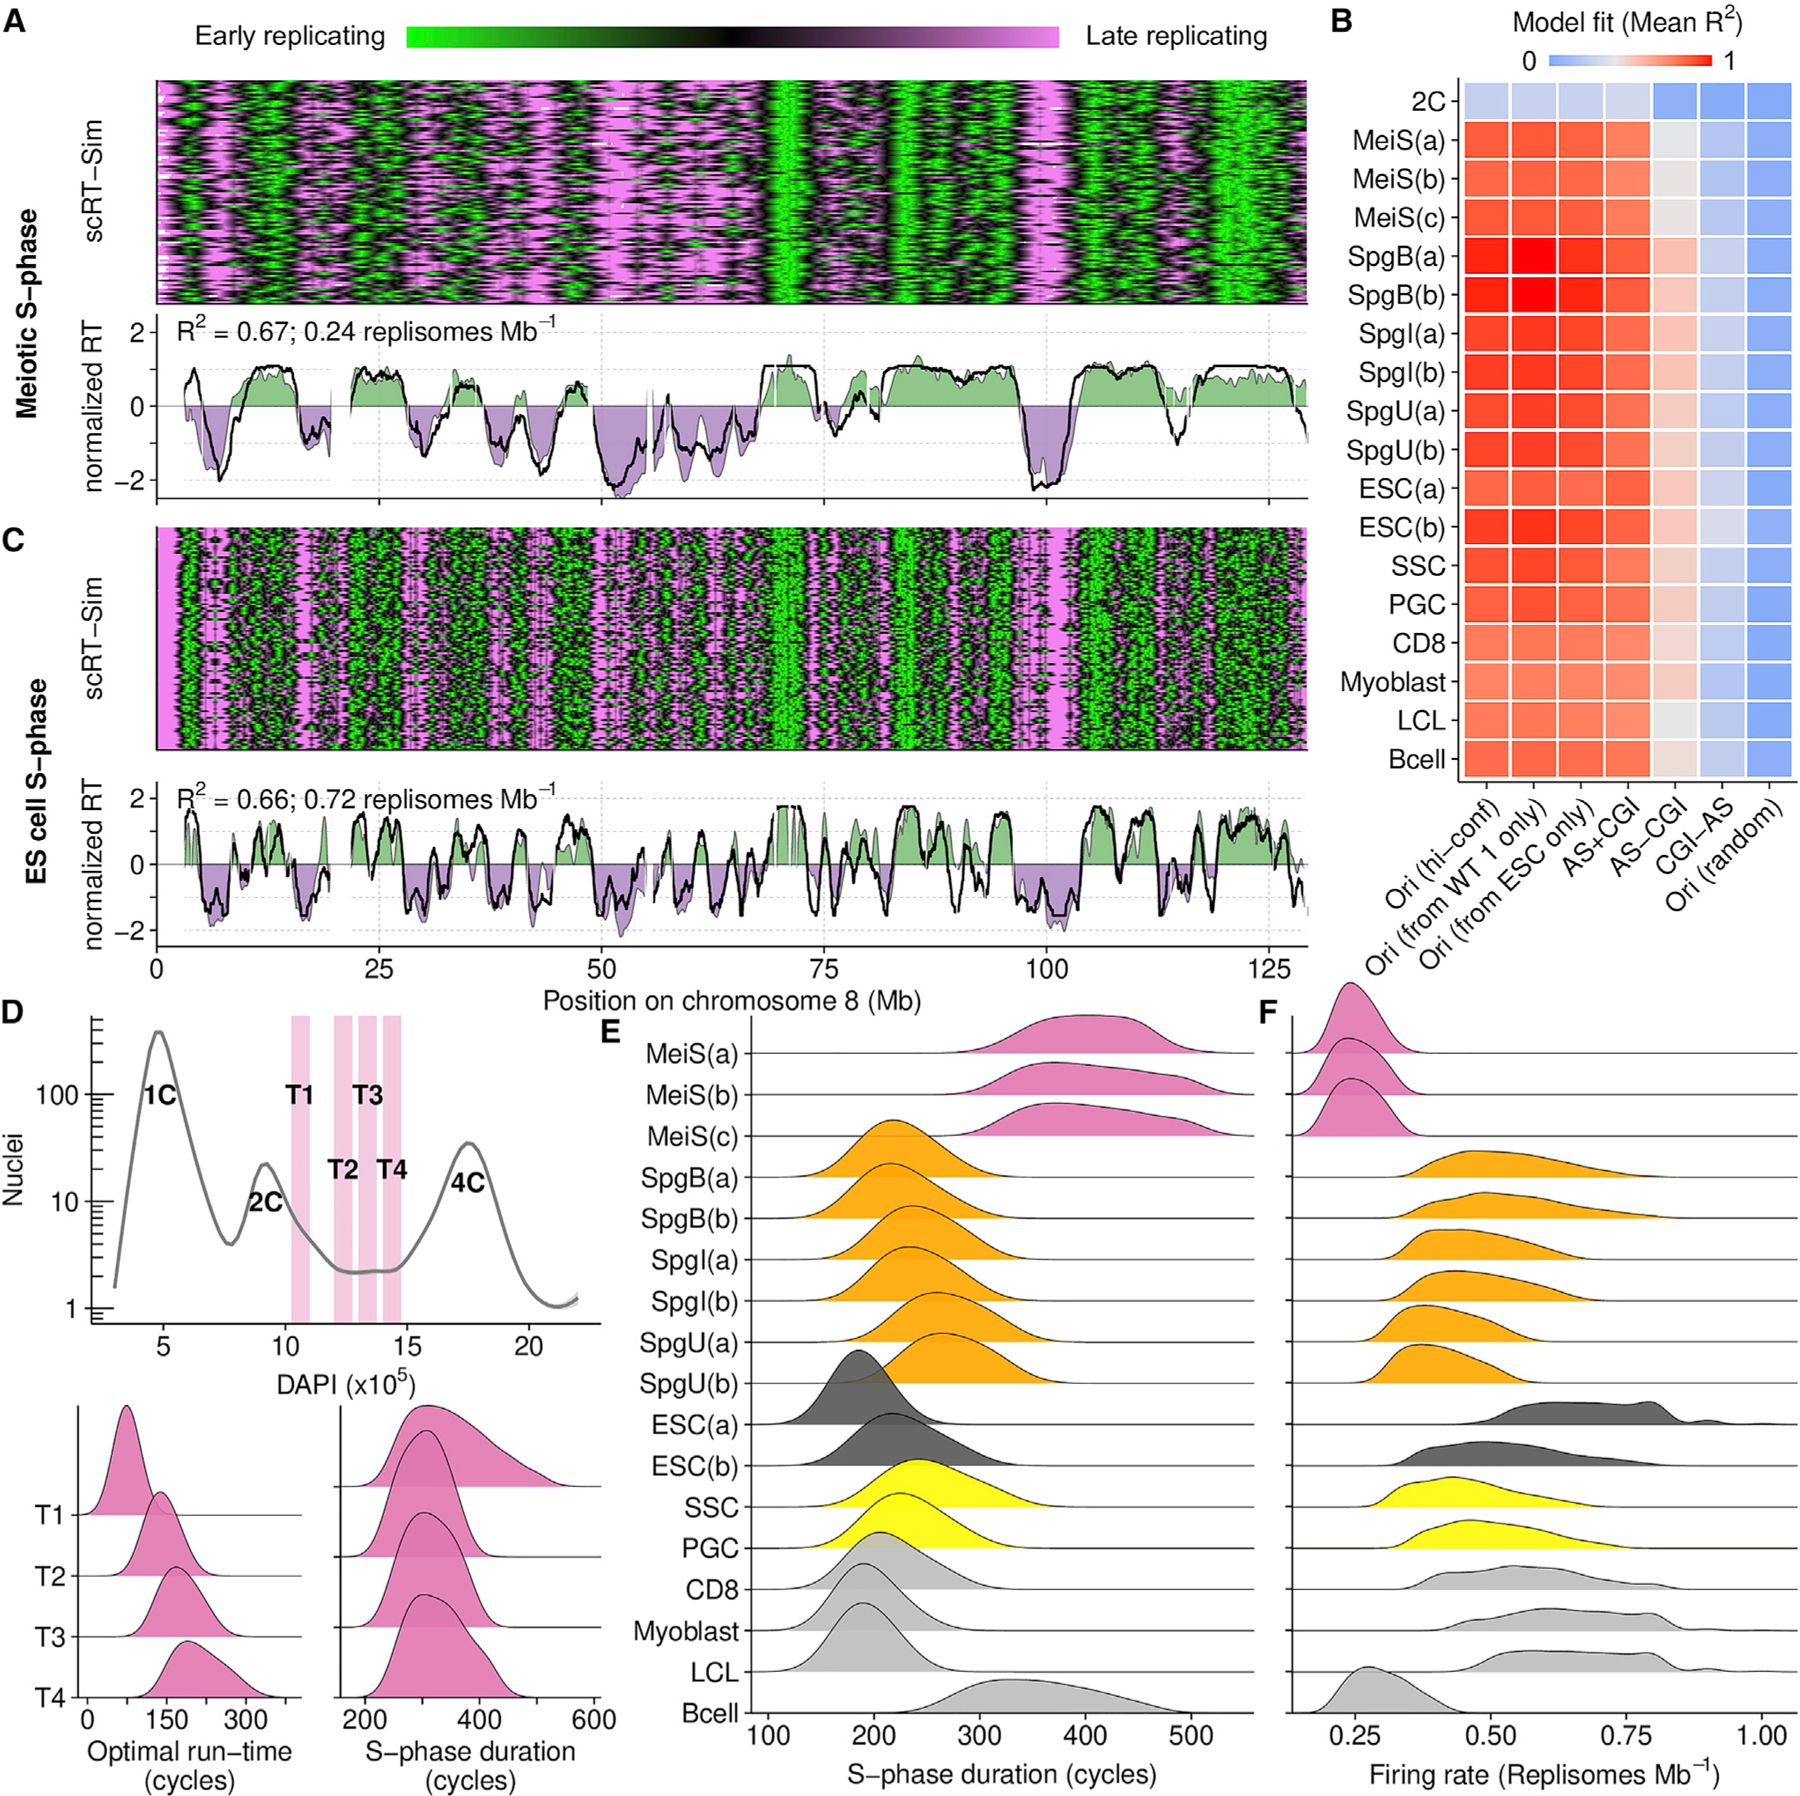
(A) Best fitting RT-sim model for meiotic S-phase RT (MeiS(a)). Heatmap shows RT in individual simulated haploid genomes. Lower panel compares experimentally determined RT (filled area) to simulated RT (black line). Both simulated and experimental RT are normalized by mean and SD ((RT — mean(RT))/SD(RT)).
(B) Fit scores for models built using RT from different cell types and different datasets as a proxy for origins. Mean of the top 0.015% of models is shown. Sample details in Tables S1, S2, and S3. Briefly, RT is from: MeiS, meiotic S-phase; Spg(B,I,U), B-type, intermediate, and undifferentiated spermatogonia; ESCs, embryonic stem cells; SSCs, spermatogonial stem cells; PGCs, primordial germ cells; CD8, CD8 cells; myoblast, myoblast cell line; LCL, lymphoblastoid cell line; Bcells, activated B cells. (a,b,c) designate replicates. ESC(a) is from our ESC culture, ESC(b) is from published whole-genome sequencing data. Ori (hi-conf), high confidence Ori-SSDS peaks; Ori(r), randomized Ori-SSDS peaks; AS+CGI, ATAC-seq peak at a CGI; AS-CGI, ATAC-seq peak not at a CGI; CGI-AS, CGI not at an ATAC-seq peak.
(C) Best fitting RT-Sim model for RT in ESC(a).
(D) Isolation of S-phase nuclei with increasing DNA content (T1–T4). The optimal simulation run-time for best-fitting models correlates with increasing DNA content. Nonetheless, the predicted S-phase duration is similar among all populations.
(E) S-phase duration estimates from RT-sim.
(F) Replisome firing rate estimates from RT-sim.
See also Figures S5, S6, and S7 and Data S1.