
Figure 5. Rapid DSB repair and elevated meiotic recombination in early-replicating regions.
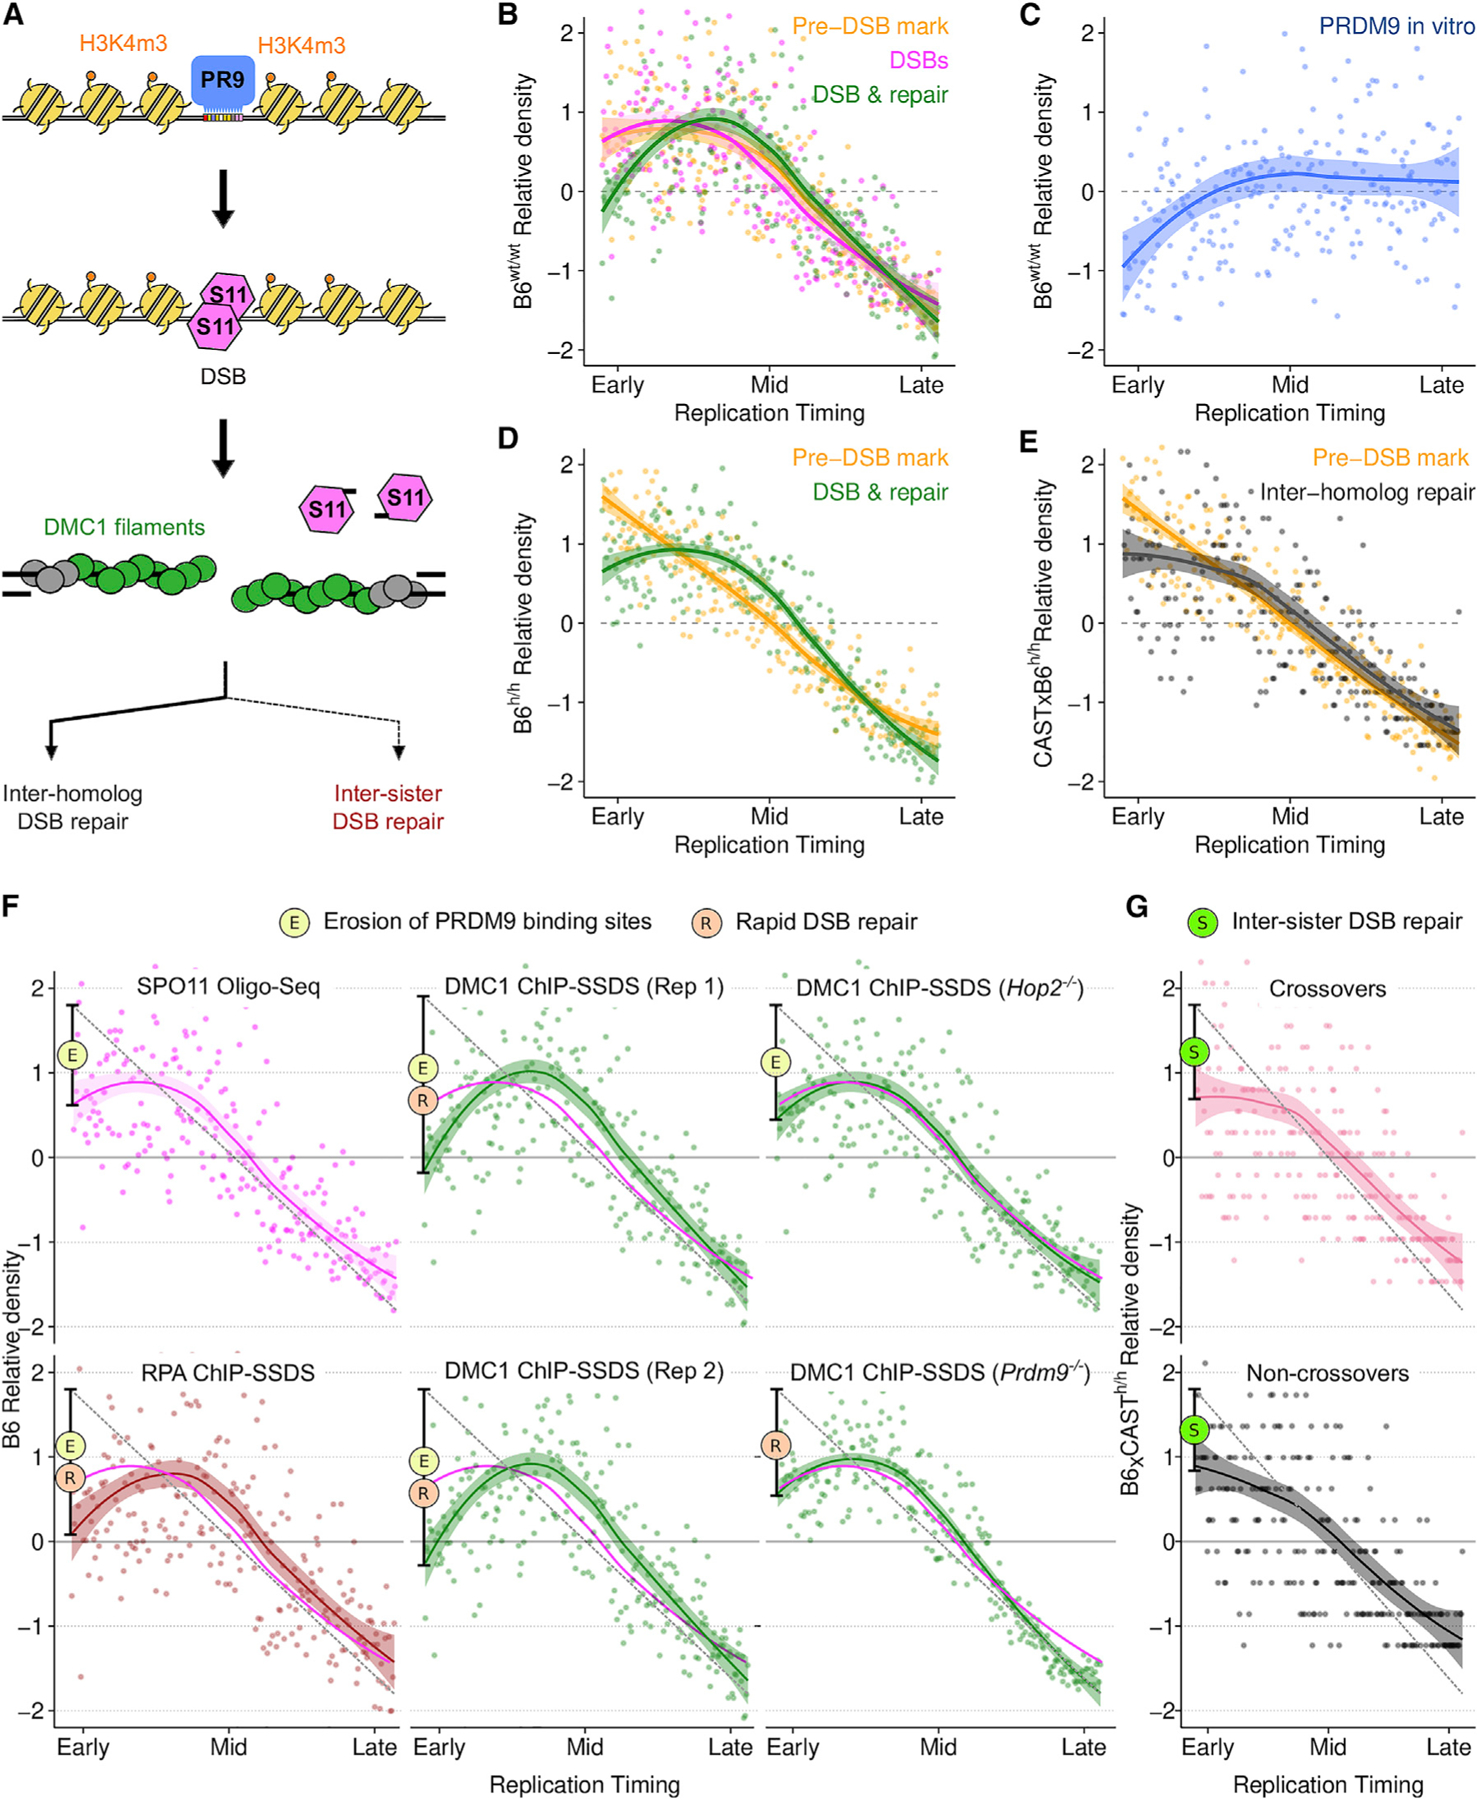
(A) Schematic of meiotic recombination (colors in B–F reflect this schematic; PR9, PRDM9; S11, SPO11).
(B and D) PRDM9-mediated H3K4m3 at DSB hotspots (yellow) is enriched in early replicating DNA in both wild-type B6 male mice (B6wt/wt) (B) and in mice with a humanized PRDM9 allele (B6h/h) (D). DSB formation (SPO11-oligo mapping; pink) follows this Pre-DSB mark (B). The DMC1-SSDS (green) signal decays relative to H3K4me3 in the earliest replicating DNA.
(C) B6 PRDM9 binding sites are depleted in early replicating DNA (measured by Affinity-seq) in the B6wt/wt genome.
(E) Inter-homolog repair products (crossovers + non-crossovers) (Li et al., 2019) are depleted in the earliest replicating DNA relative to DSB-associated H3K4m3 (H3K4m3 data as in D, plotted against B6xCAST RT).
(F) The rate of DSB formation (magenta) is superimposed on all panels. RPA-SSDS signal is depleted in the earliest replicating DNA. Two replicates of DMC1-SSDS are shown (Rep 1 is also in B). Note that PRDM9 binding site erosion does not affect PRDM9-independent DSB hotspots.
(G) Both crossovers (COs) and Non-crossovers (NCO) are depleted in the earliest replicating DNA. For all figures, dots represent the average signal from all autosomal bins for each RT quantile (N = 250). Simulated RT is from the T1 B6 meiocyte population (B–D and F) or from a B6xCAST F1 hybrid (E and G). RT patterns are very similar in B6 and B6xCAST. Solid lines depict a LOESS smoothed signal ± SE (shaded; span = 0.8). The dashed gray line is a projected linear correlation and the deviation from this is shown (black bar) (F and G). Phenomena contributing to each dip are indicated by colored circles.
See also Data S1.