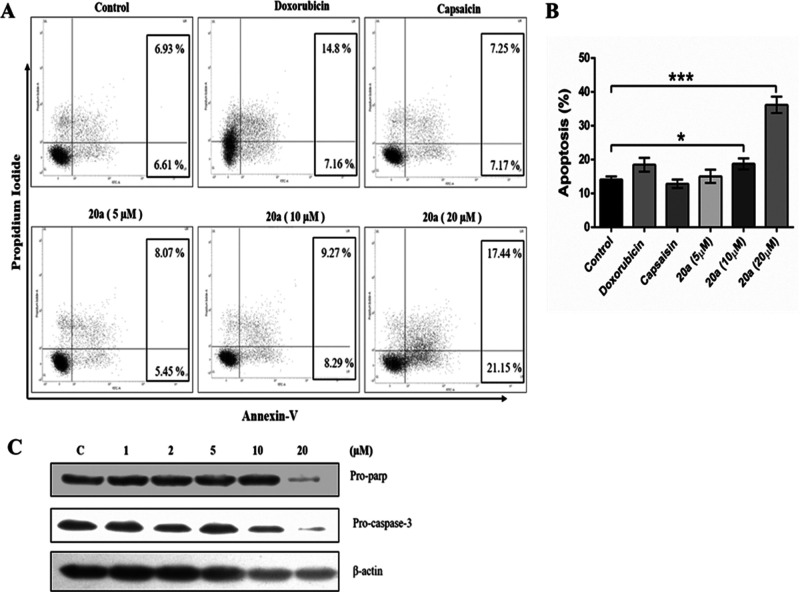
Figure 9.
Compound 20a induced apoptosis in NCI-H460 cells. (A) Flow cytometric analysis demonstrated the levels of apoptosis in NCI-H460. (B) Quantitative analysis of apoptosis. Data represents the mean ± SD of the percentage of apoptotic cells (n = 3), *p < 0.05, ***p < 0.001, compared to the vehicle control as determined by t test. (C) Western blot analysis of the effect of compound 20a on the levels of Pro-parp and Pro-caspase 3 proteins in NCI-H460.

