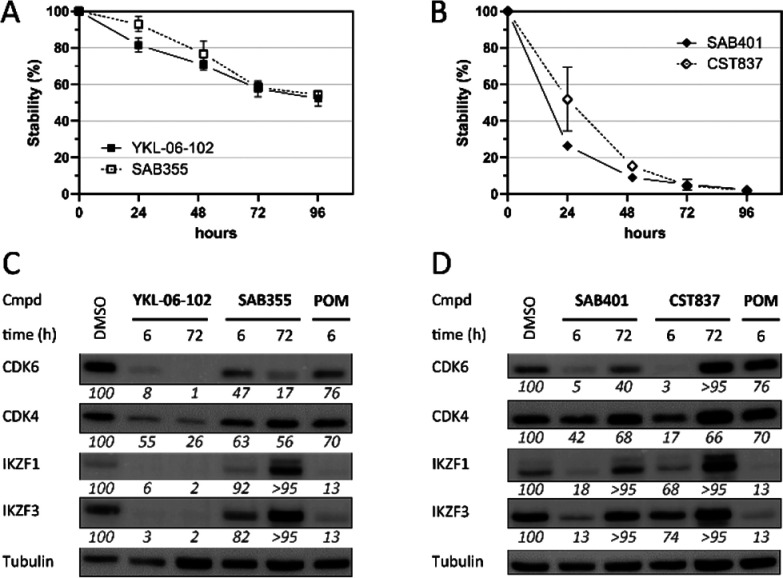
Figure 3.
Stability and target degradation profiles of tailored CDK4- or CDK6-targeting PROTACs. (A and B) Percentage remaining starting material as determined by HPLC after incubation in pH 7.4 buffer. Values represent the mean of three independent repeats. (C and D) Protein levels in MM.1S cells after a 6 or 72 h of treatment with a 1 μM concentration of the compounds. Representative Western blots are shown. Values refer to the mean of triplicate measurements and are normalized to DMSO-treated cells and the respective loading controls (100%).

