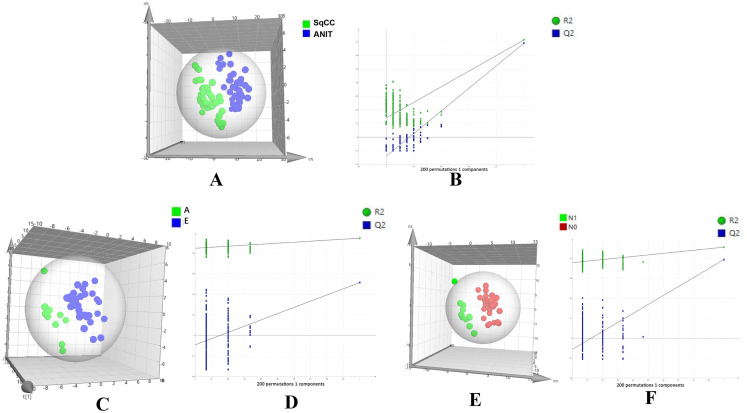
Figure 2.
PLS-DA score plot and permutation testing to differentiate between different samples. The X and Y axes in permutation test plots represent the prediction and explanatory ability of the PLS-DA model, respectively. (A) Score plot showing differences in lipids between SqCC tumor tissues and ANIT (R2Y [cum] = 0.723, Q2 [cum] = 0.697). (B) Permutation testing (n = 200). (R2 intercept = 0.187, Q2 intercept = − 0.148, P = .004). (C) Score plot showing differences in lipids between advanced- (A) and early (E)-stage SqCC (R2Y [cum] = 0.947, Q2 [cum] = 0.533). (D) Permutation testing (n = 200). (R2 intercept = 0.848, Q2 intercept = − 0.091, P = .024).
Abbreviations: SqCC, squamous cell carcinoma; ANIT, adjacent noninvolved tissues; PLS-DA, partial least squares-discriminant analysis.

