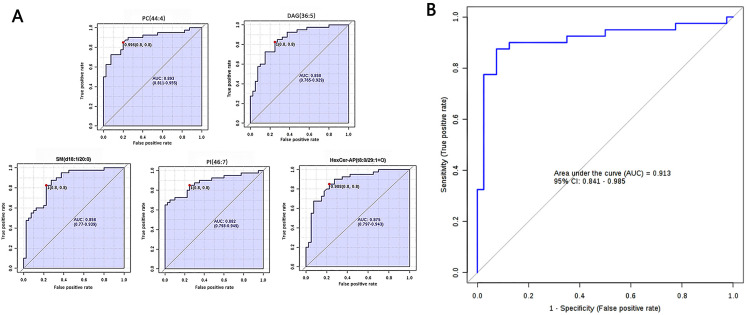
Figure 4.
Differential characteristics of the lipid profile panel, composed of five lipids, were used for distinguishing SqCC tumor tissues from ANIT. (A) Area under the curve values obtained from univariate ROC analysis of the five lipids. PC(44:4), AUC = 0.893 (95% CI: 0.811-0.955); DAG(36:5), AUC = 0.858 (95% CI: 0.765-0.929); SM(d18:1/20:0), AUC = 0.858 (95% CI: 0.770-0.939); PI(46:7), AUC = 0.882 (95% CI: 0.798-0.949); Hexer-AP(t8:0/29:1 + O), AUC = 0.875 (95% CI: 0.797-0.943). (B) ROC curve with 10-fold cross-validation, illustrating the classification performance of the lipid profile panel for distinguishing between SqCC tumor tissues and ANIT. AUC: 0.913, 95% CI: 0.841-0.985, sensitivity: 0.875, and specificity: 0.925.
Abbreviations: SqCC, squamous cell carcinoma; ANIT, adjacent noninvolved tissues; ROC, receiver operating characteristic curve; AUC, area under the curve; CI, confidence interval; PC, phosphatidylcholine; DAG, diacylglycerol; SM, sphingomyelin; PI, phosphatidylinositol.

