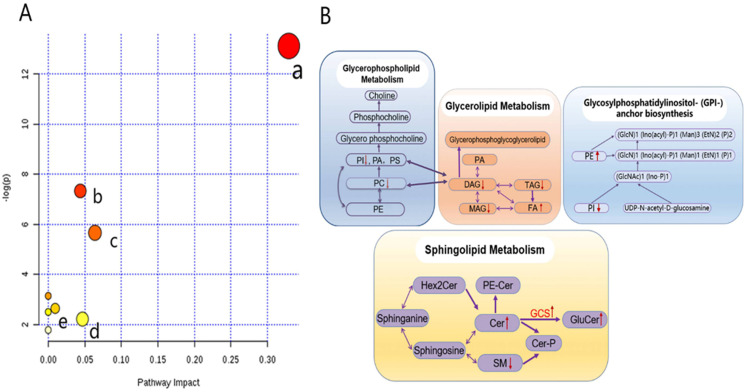
Figure 5.
Lipidomics schema of significantly altered lipids and pathways between SqCC tumor tissues and ANIT. (A) Pathway analysis revealed significant differences in five metabolic pathways. In the scatter plot, the X-axis indicates the impact on the pathway, whereas the Y-axis indicates significant changes in a pathway, by detected lipid (in red). a: Glycerophospholipid metabolism; b: glycosylphosphatidylinositol anchor biosynthesis; c: glycerolipid metabolism; d: linoleic acid metabolism; e: sphingolipid metabolism. “P” is the value calculated from the enrichment analysis, and “impact” is the pathway impact value calculated from the pathway topology analysis. (B) Pathway analysis show the interrelation of altered lipids and associated metabolic pathways in SqCC tumor tissues and indicates elevated and reduced levels, respectively.
Abbreviations: PE, phosphatidylethanolamine; PC, phosphatidylcholine; PI, phosphatidylinositol; PA, phosphatidic acid; PS, phosphatidylserine; MAG, monoacylglycerol; DAG, diacylglycerol; TAG, triacylglycerol; FA, free fatty acid; Hex2Cer, dihexosylceramide; PE-Cer, ceramide phosphoethanolamine; SM, sphingomyelin; Cer-P, ceramide 1-phosphate; GCS, glucosylceramide synthase; GluCer, glucosylceramides; SqCC, squamous cell carcinoma; ANIT, adjacent noninvolved tissues.

