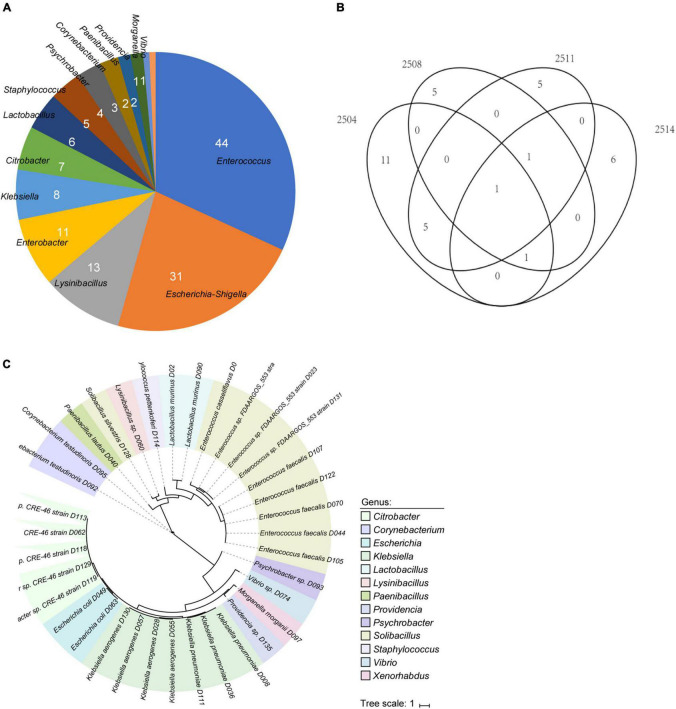
FIGURE 1.
Overview of the cultivated bacteria from bile specimens. (A) Pie plot shows the composition of 138 bacterial colonies. (B) Venn diagram of the distribution of isolates in the four bile samples. (C) Phylogenetic tree of 35 whole-genome sequenced isolates. Color represents the genus assignment of the isolates.

