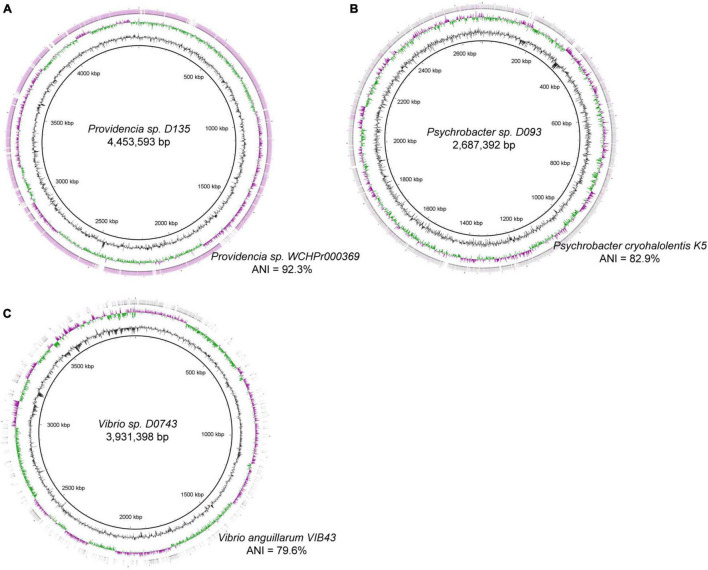
FIGURE 2.
Circular representation of the genomes of four novel species, including (A) Providencia sp. D135, (B) Psychrobacter sp. D093, and (C) Vibrio sp. D074. For each genome, the inner three circles represent the genome scale, G + C skew, and G + C content; the outer circle(s) shows the genome region that have close orthologs with the closest strains in the National Center of Biotechnology Information (NCBI) database. Average nucleotide identity (ANI) of the bile genomes and its closest strains are shown.

