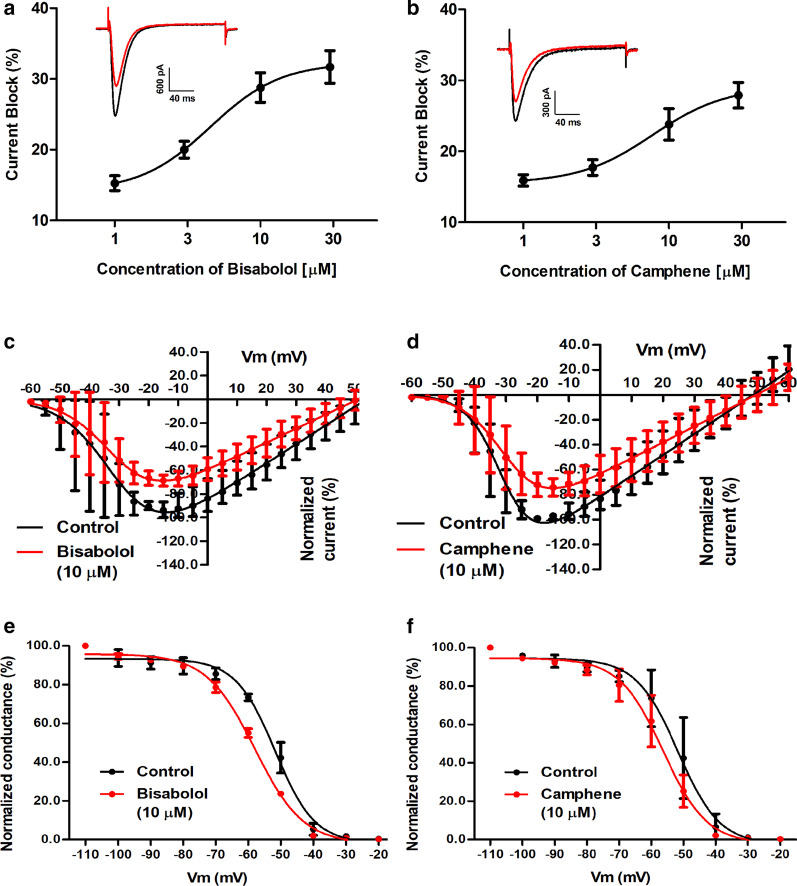
Fig. 2.
a Dose–response relation for alpha-bisabolol inhibition of Cav3.2 channels expressed in tsA-201 cells. The IC50 obtained from the fit was 4.52 ± 1.08 µM (n = 3 per dose). The insert shows a representative current before and after the application of 10 µM of alpha-bisabolol. b Dose–response relation for camphene inhibition of Cav3.2. The IC50 obtained from the fit was 7.73 ± 1.75 µM (n = 3 per dose). The insert shows a representative current before and after the application of 10 µM of camphene. c Effect of alpha-bisabolol on the current–voltage relation of Cav3.2. The half activation potentials obtained from the fitted curves were − 30.7 ± 1.9 mV and − 31.2 ± 1.8 mV before and after the application of alpha-bisabolol, respectively (10 µM, n = 3, p = 0.96, Paired t test). d Effect of camphene on the current–voltage relation of Cav3.2. The half activation potentials obtained from the fitted curves were − 30.9 ± 0.9 mV and − 29.5 ± 1.5 mV before and after the application of camphene, respectively (10 µM, n = 3, p = 0.70, Paired t test). e Effect of alpha-bisabolol on the steady-state inactivation curve of Cav3.2. The half-inactivation potentials from the fitted curves were − 51.7 ± 0.7 mV and − 57.9 ± 0.4 mV before and after the application of alpha-bisabolol (10 µM, n = 3, p = 0.02, Paired t test). f Effect of camphene on the steady-state inactivation curve of Cav3.2. The half-inactivation potentials from the fitted curves were − 51.7 ± 1.3 mV and − 56.3 ± 0.9 mV before and after the application of camphene (10 µM, n = 3, p = 0.04, Paired t test)

