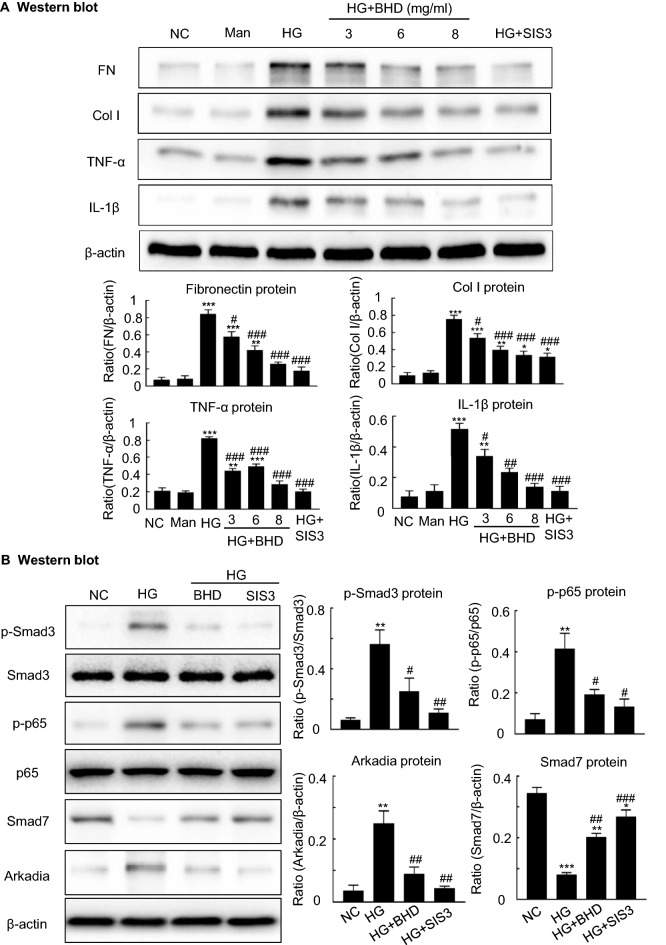
Fig. 7.
The underlying mechanisms by which BHD reduces high glucose-induced fibrosis and inflammation in vitro. A Western blot and quantitative data for fibronectin (FN), collagen I (Col I), interleukin-1β (IL-1β) and TNF-α. B Western blot and quantitative data for phosphorylated Smad3, phosphorylated p65, Smad7 and Arkadia. Man, mannitol (osmolality control). HG, high glucose; SIS3, a specific Smad3 inhibitor, 2 μM. Data represent the means ± SEM from 3–4 independent experiments. *P < 0.05, **P < 0.01, ***P < 0.001 versus normal control. #P < 0.05, ##P < 0.01, ###P < 0.001 versus high glucose

