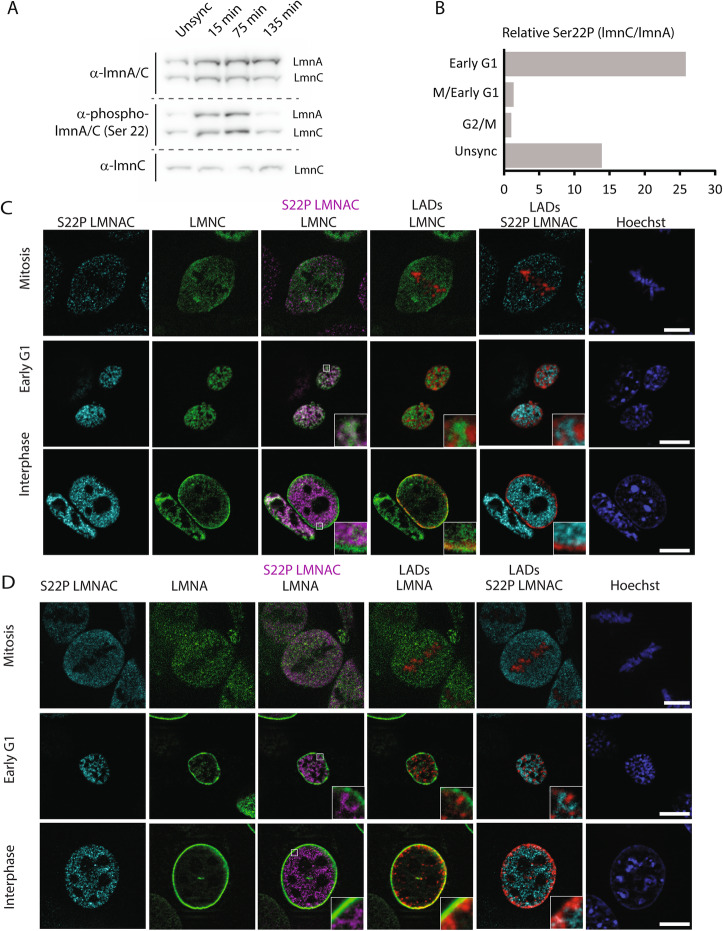
Fig. 5.
Both lamin A and C are phosphorylated on serine 22 during mitosis and this modification is found on nucleoplasmic lamins, particularly lamin C, in interphase. A Representative western blot of whole cell lysates from MEFs that have been unsynchronized or synchronized and released for 15min, 75min, or 135min, stained for lamin A/C, lamin C, or phospho-serine 22 lamin A/C. B Quantification of western blot. The phosphorylation levels (detected by anti-phospho serine 22 lamin A/C) of lamin A and lamin C were first normalized to their endogenous levels of the isoforms (lamin A/C staining) to account for differential expression of lamin A and C relative to each other. The ratio of the normalized levels of phosphorylated isotypes is then plotted to monitor relative changes in phosphorylation, with a ratio of “1” correlating with lamin A and C having equal amounts of phosphorylation. C Representative images of MEFs expressing the LAD tracer system (red) and EGFP-lmnC (green) stained with anti-phospho-serine Lamin A/C (cyan or magenta) and counterstained with Hoechst 33342 (blue) during mitosis, early G1 and interphase. Phospho-serine 22 lamin A/C was pseudo-colored magenta to enhance contrast with the lamin C overlay. Scale bar indicated by white line is 10μm. D Representative images of MEFs expressing the LAD tracer system (red) stained with anti-phospho-serine lamin A/C (cyan or magenta) and anti-lamin A (green), and counterstained with Hoechst 33342 (blue) during mitosis, early G1 and interphase. Phospho-serine 22 lamin A/C was pseudo-colored in magenta to enhance contrast with the lamin A overlay. Scale bar indicated by white line is 10μm

