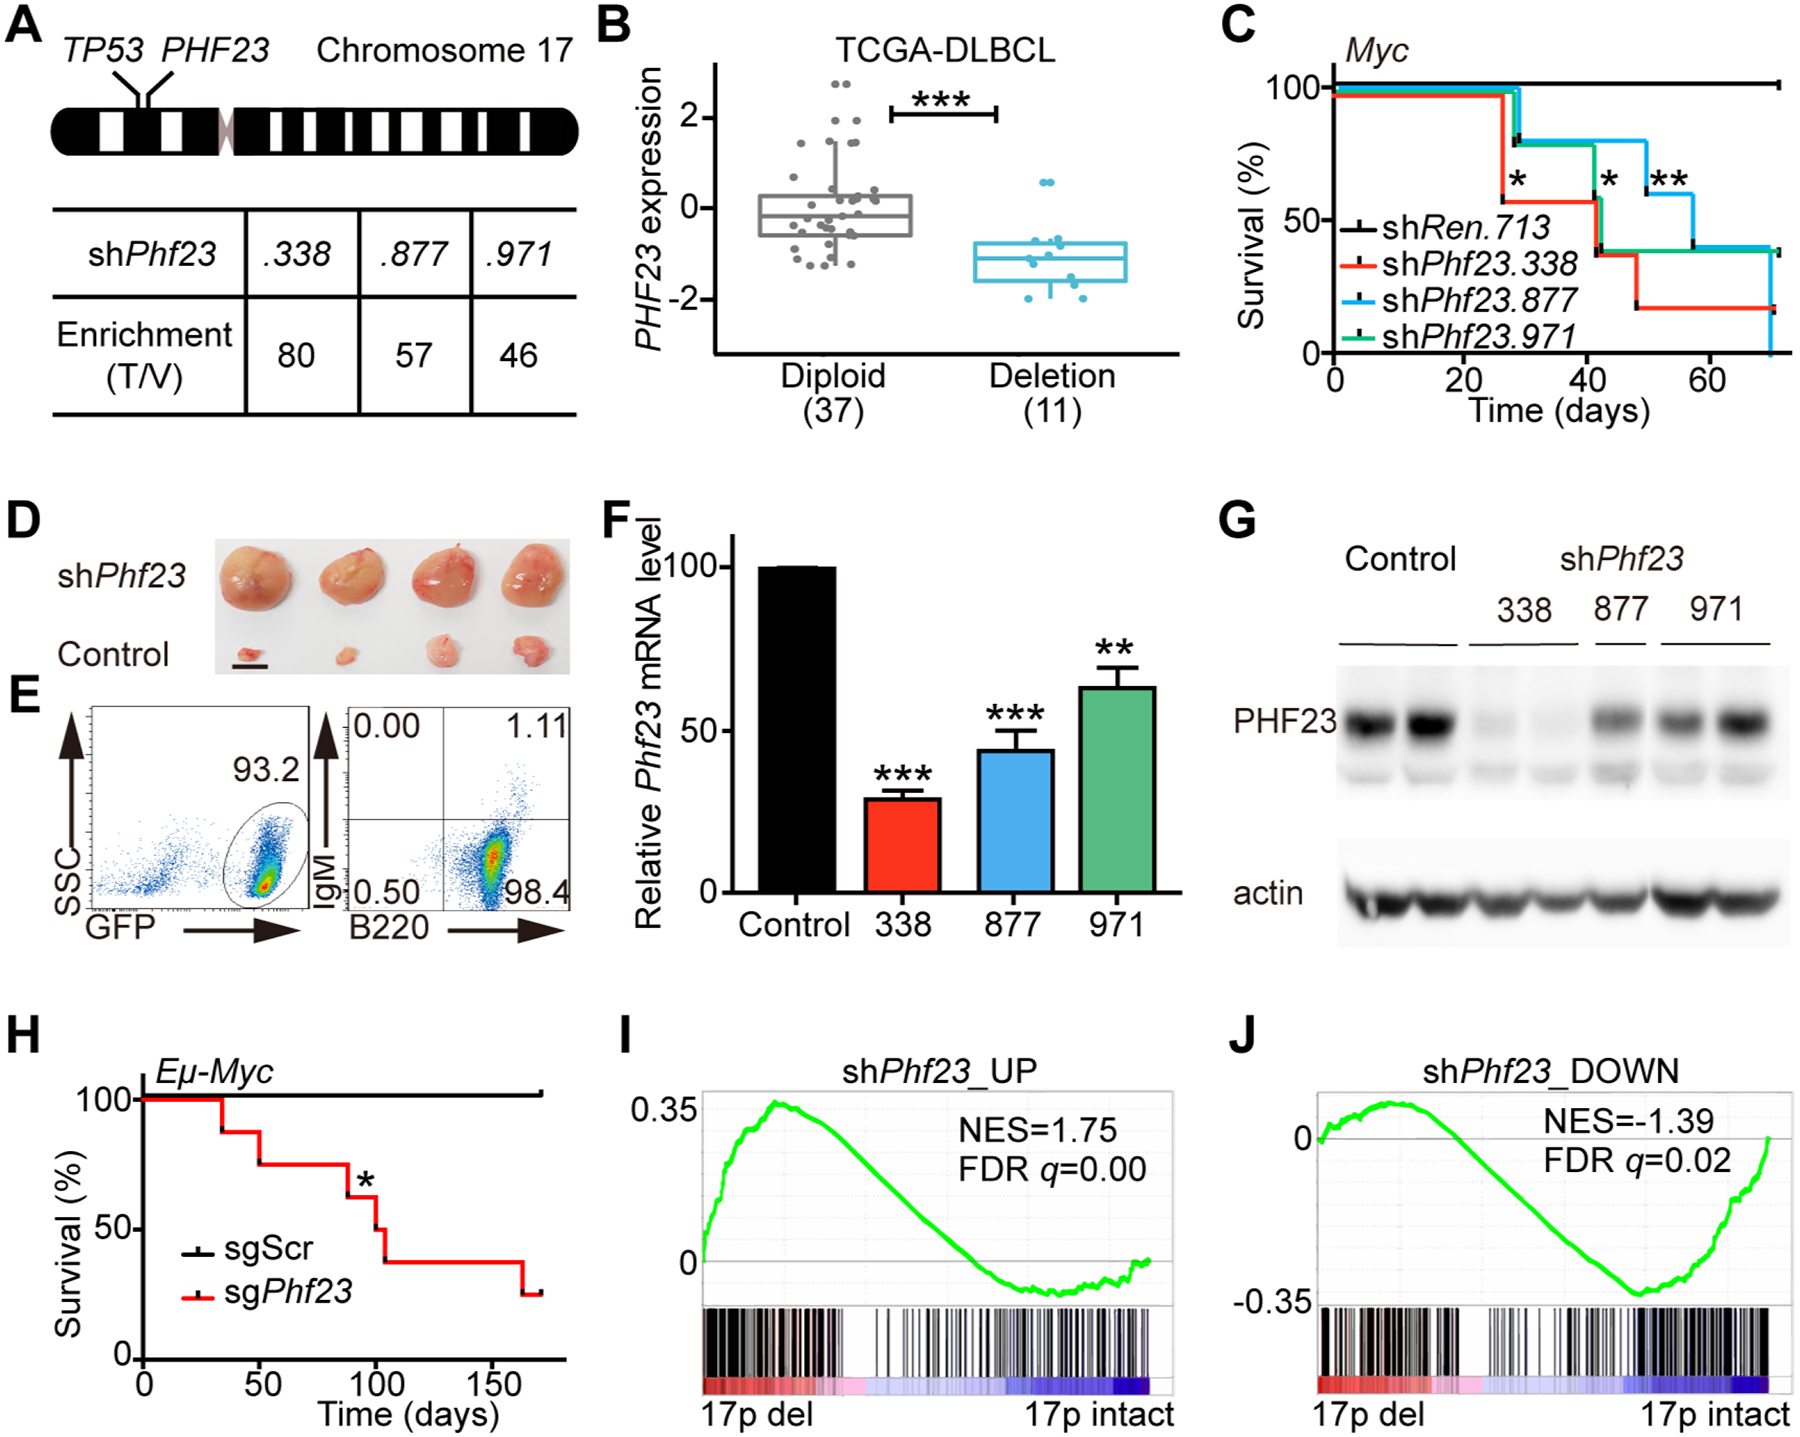
Figure 1 |. Phf23 deficiencies promoted lymphomagenesis.

A, Top, a schematic diagram of human chromosome 17, showing the relative positions of TP53 and PHF23 on 17p. Bottom, the enrichment folds of Phf23 shRNAs in the shRNA library screening of mouse chromosome 11B3 genes in Myc-driven lymphoma/leukemia in mice. The enrichment folds were calculated by dividing the percentages of each shRNA reads in tumors by those in the library of plasmids. B, The expression levels of PHF23 in DLBCL patients with (Deletion) or without (Diploid) chromosome 17p deletions. RNA-seq data with RSEM were analyzed from TCGA. *** padj < 0.001, Wilcoxon signed-rank test. C, Kaplan-Meier tumor-free survival curves of recipient mice transplanted with pre-B cells infected with Myc cDNA and indicated shRNAs. n=5 for each group. *p<0.05, **p<0.01 (log-rank test). D, Representative picture showing enlarged lymph nodes in recipient mice with shPhf23. Scale bar, 5mm. E, Representative flow plots showing the expressions of GFP, B220 and IgM of shPhf23 lymphoma/leukemia cells. F, Relative expression levels of Phf23 in shPhf23 lymphoma/leukemia cells, measured by qPCR. Control, shTrp53;Myc lymphoma/leukemia cells. G, Representative Western blotting picture showing the protein levels of PHF23 in shPhf23 lymphoma/leukemia cells. Control, shTrp53;Myc lymphoma/leukemia cells. H, Kaplan-Meier tumor-free survival curves of recipient mice transplanted with Eμ-Myc fetal liver cells (FLCs) with CRISPR/Cas9 targeting Phf23 or scramble sequence. n=5, sgScr; n=8, sgPhf23. *p<0.05 (log-rank test). I, Gene Set Enrichment Analysis (GSEA) showing the positive enrichment of the shPhf23 lymphoma/leukemia upregulated gene set in 17p deleted TCGA DLBCL, comparing to 17p intact ones (NES=1.75; FDR q=0.00). J, GSEA showing the negative enrichment of the shPhf23 lymphoma/leukemia downregulated gene set in 17p deleted TCGA DLBCL, comparing to 17p intact ones (NES=−1.39; FDR q=0.02).
