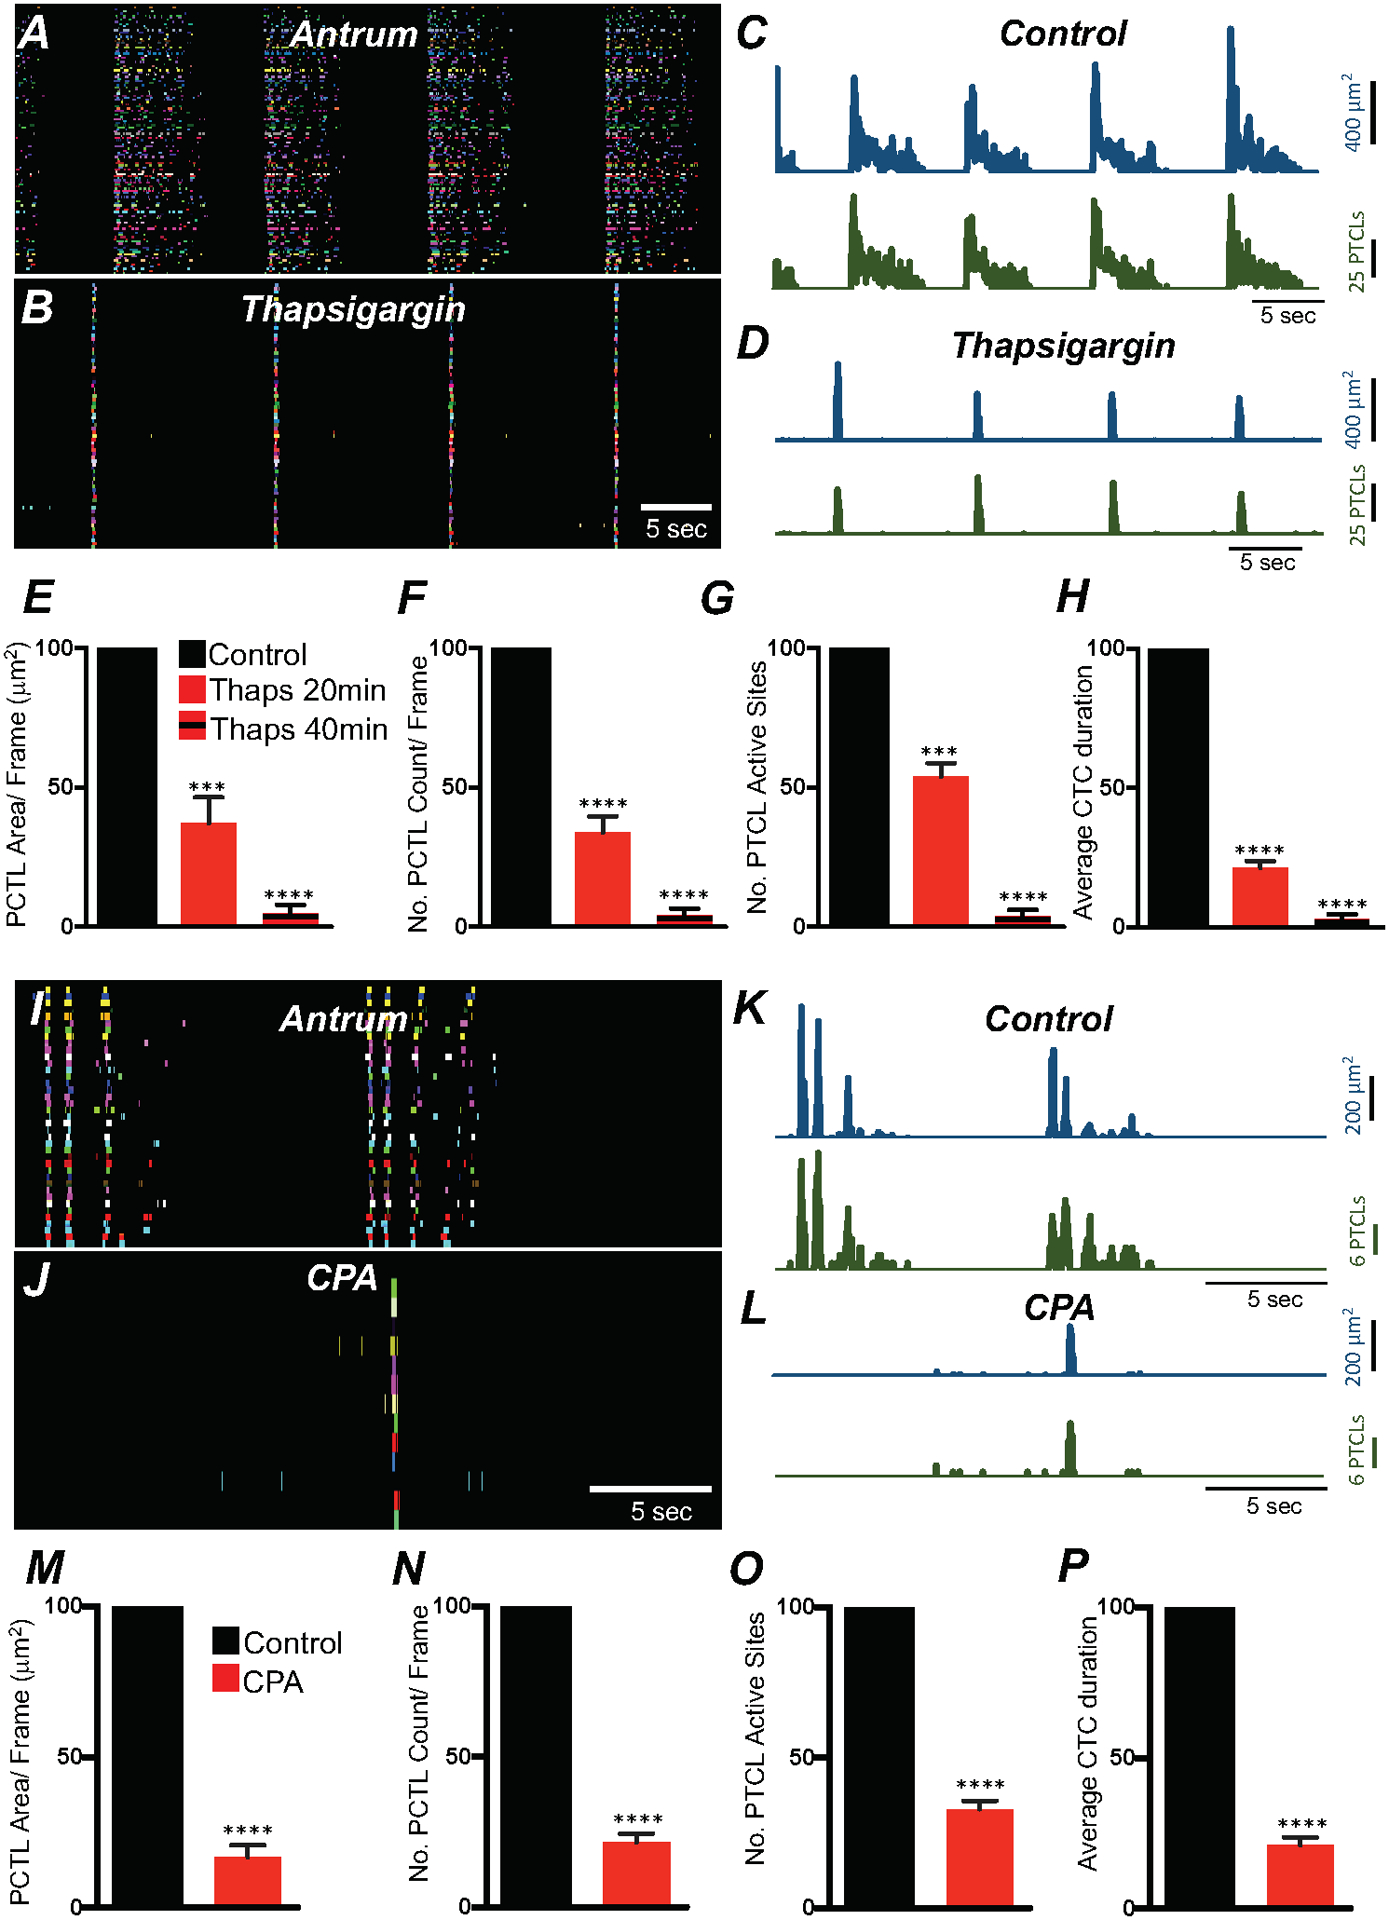
Fig. 12. Ca2+ stores contributions to Ca2+ transients in antrum ICC-MY.

A ICC-MY Ca2+ firing site activity in antrum ICC-MY are color-coded and plotted in occurrence maps under control conditions and in the presence of thapsigargin (1 μM) B. Plot traces of firing sites PTCL area (C; blue) and PTCL count (C; green) under control conditions and in the presence of thapsigargin PTCL area (D; blue) and PTCL count (D; green). Summary graphs of Ca2+ PTCL activity in ICC-MY in the presence of thapsigargin after 20 min and 40 min incubation periods are shown in E (PTCL area), F (PTCL count), G the number of PTCL active sites and H Average percentage changes of Ca2+ transient clusters (CTCs) duration (n = 6). CPA (SERCA pump inhibitor; 10 μM) reduced transients compared to control as shown in occurrence maps of firing sites I&J and Ca2+ activity traces K&L. Summary graphs of Ca2+ PTCL activity in ICC-MY in the presence of CPA are shown in M (PTCL area), N (PTCL count), O the number of PTCL active sites. P Total CTC duration (n = 5). Data were normalized to controls and expressed as percentages (%). Significance determined using unpaired t-test, **** = P < 0.0001. All data graphed as mean ± SEM.
