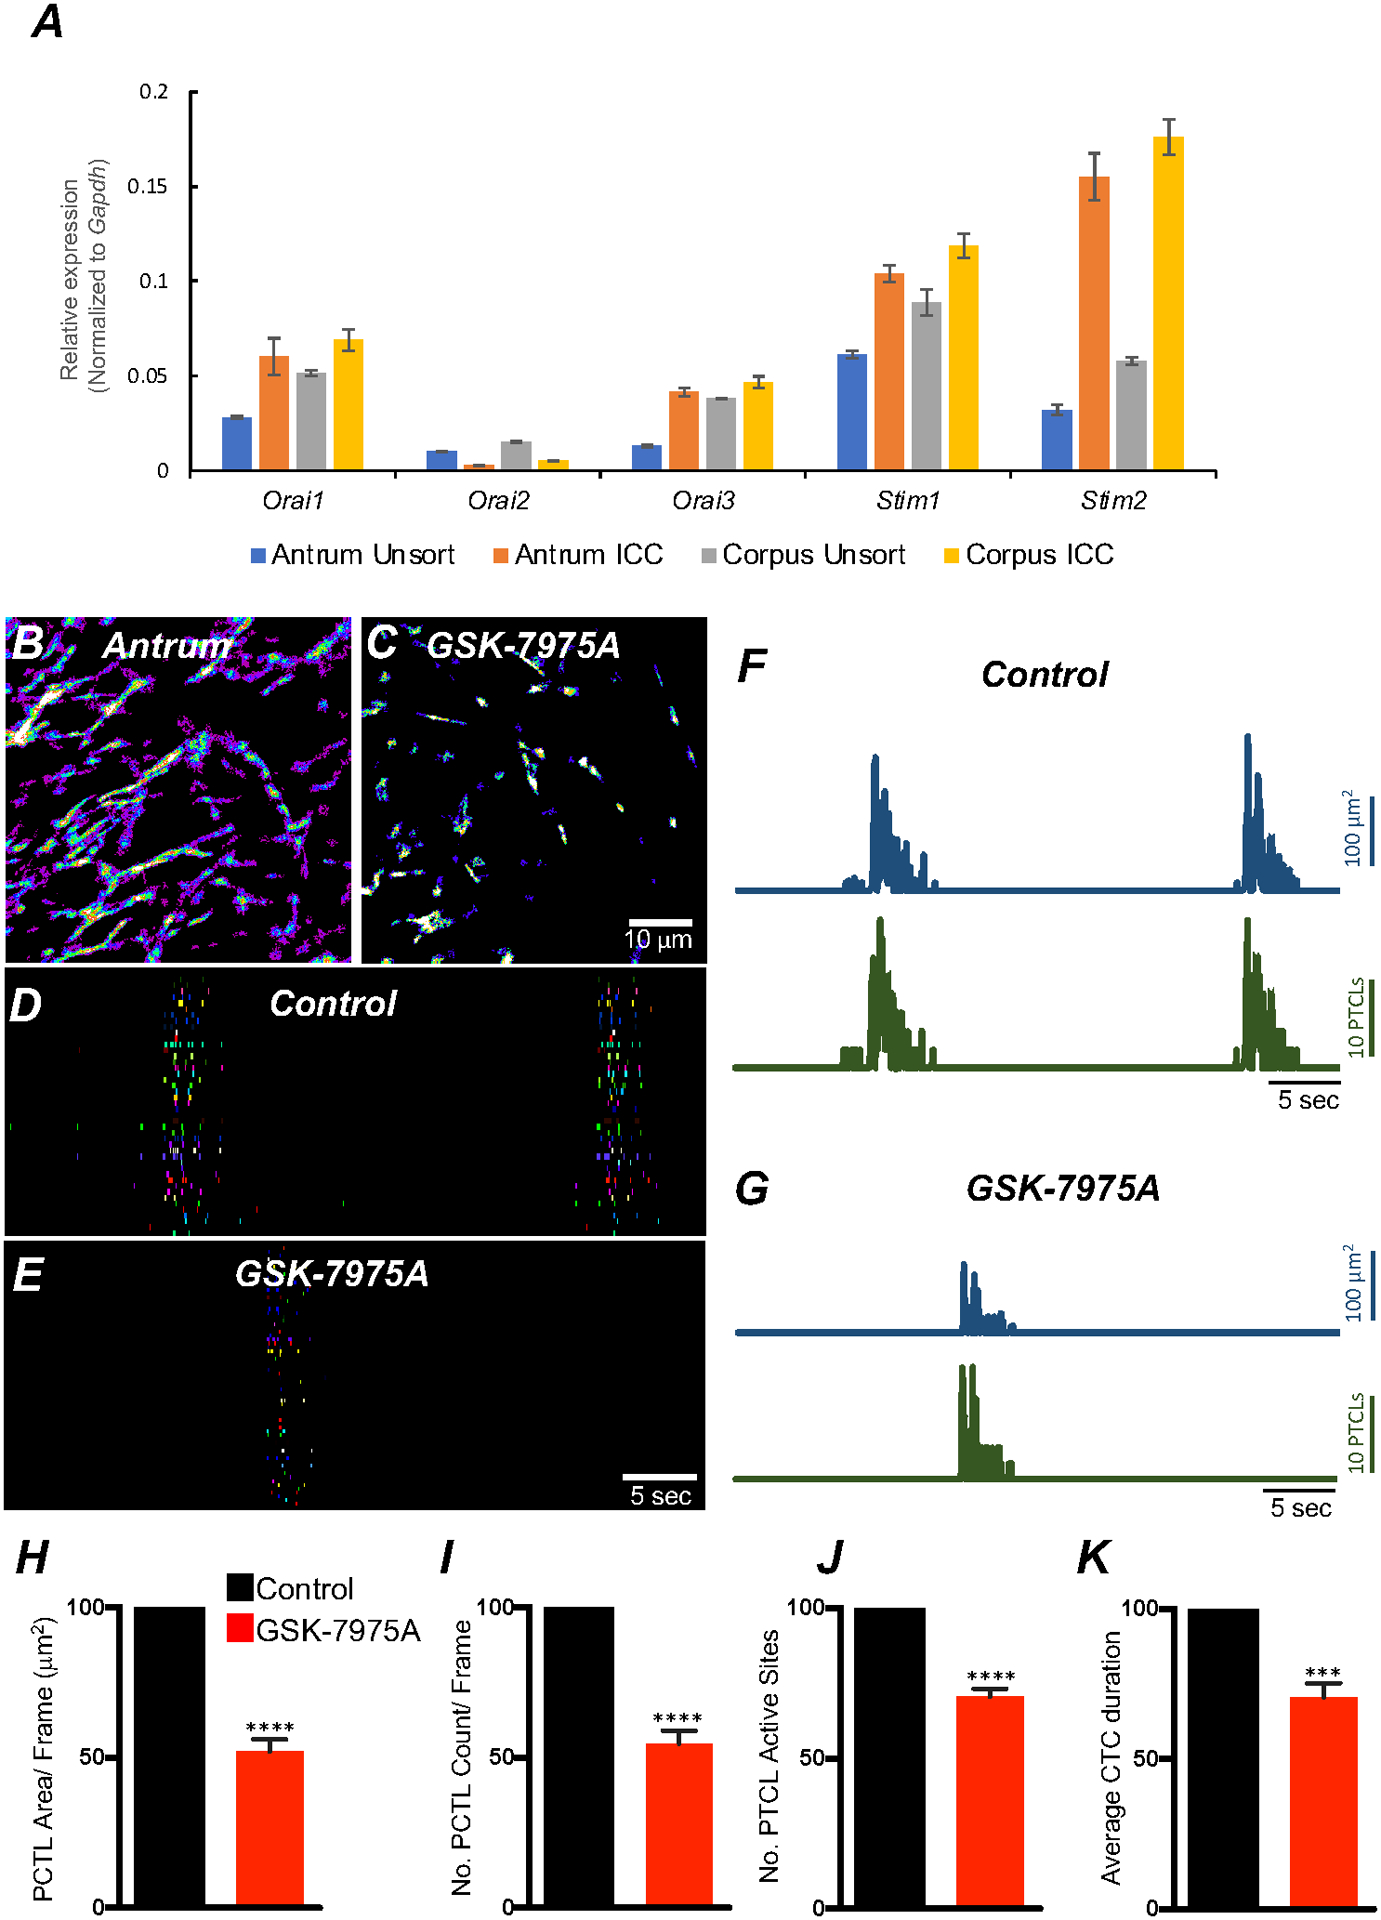
Fig. 14. Role of SOCE in maintaining ICC-MY Ca2+ transients.

A Relative expression of store-operated Ca2+ entry (SOCE) channels (Orai1, Orai2 and Orai3) and stromal interaction molecules STIM1 and STIM2 in gastric ICC and compared with unsorted cells dispersed from gastric antrum and corpus tissues obtained from Kit+/copGFP mice. B Heat-map images of an antrum ICC-MY networks showing total active Ca2+ PTCLs under control conditions and in the presence of GSK-7975A (C, 10 μM, for 20 min). D & E occurrence maps of color-coded Ca2+ firing sites showing the effect of the SOCE channel antagonist, GSK-7975A (10 μM) on ICC-MY Ca2+ transients. Traces of PTCL area (F; blue) and PTCL count (F; green) under control conditions and in the presence of GSK-7975A, PTCL area (G; blue) and PTCL count (G; green). Summary graphs of Ca2+ PTCL activity in ICC-MY in the presence of GSK-7975A are shown in H (PTCL area), I (PTCL count), J the number of PTCL active sites and K Average percentage changes of Ca2+ transient clusters (CTCs) duration (n = 6). Significance determined using unpaired t-test, **** = P < 0.0001. All data graphed as mean ± SEM.
