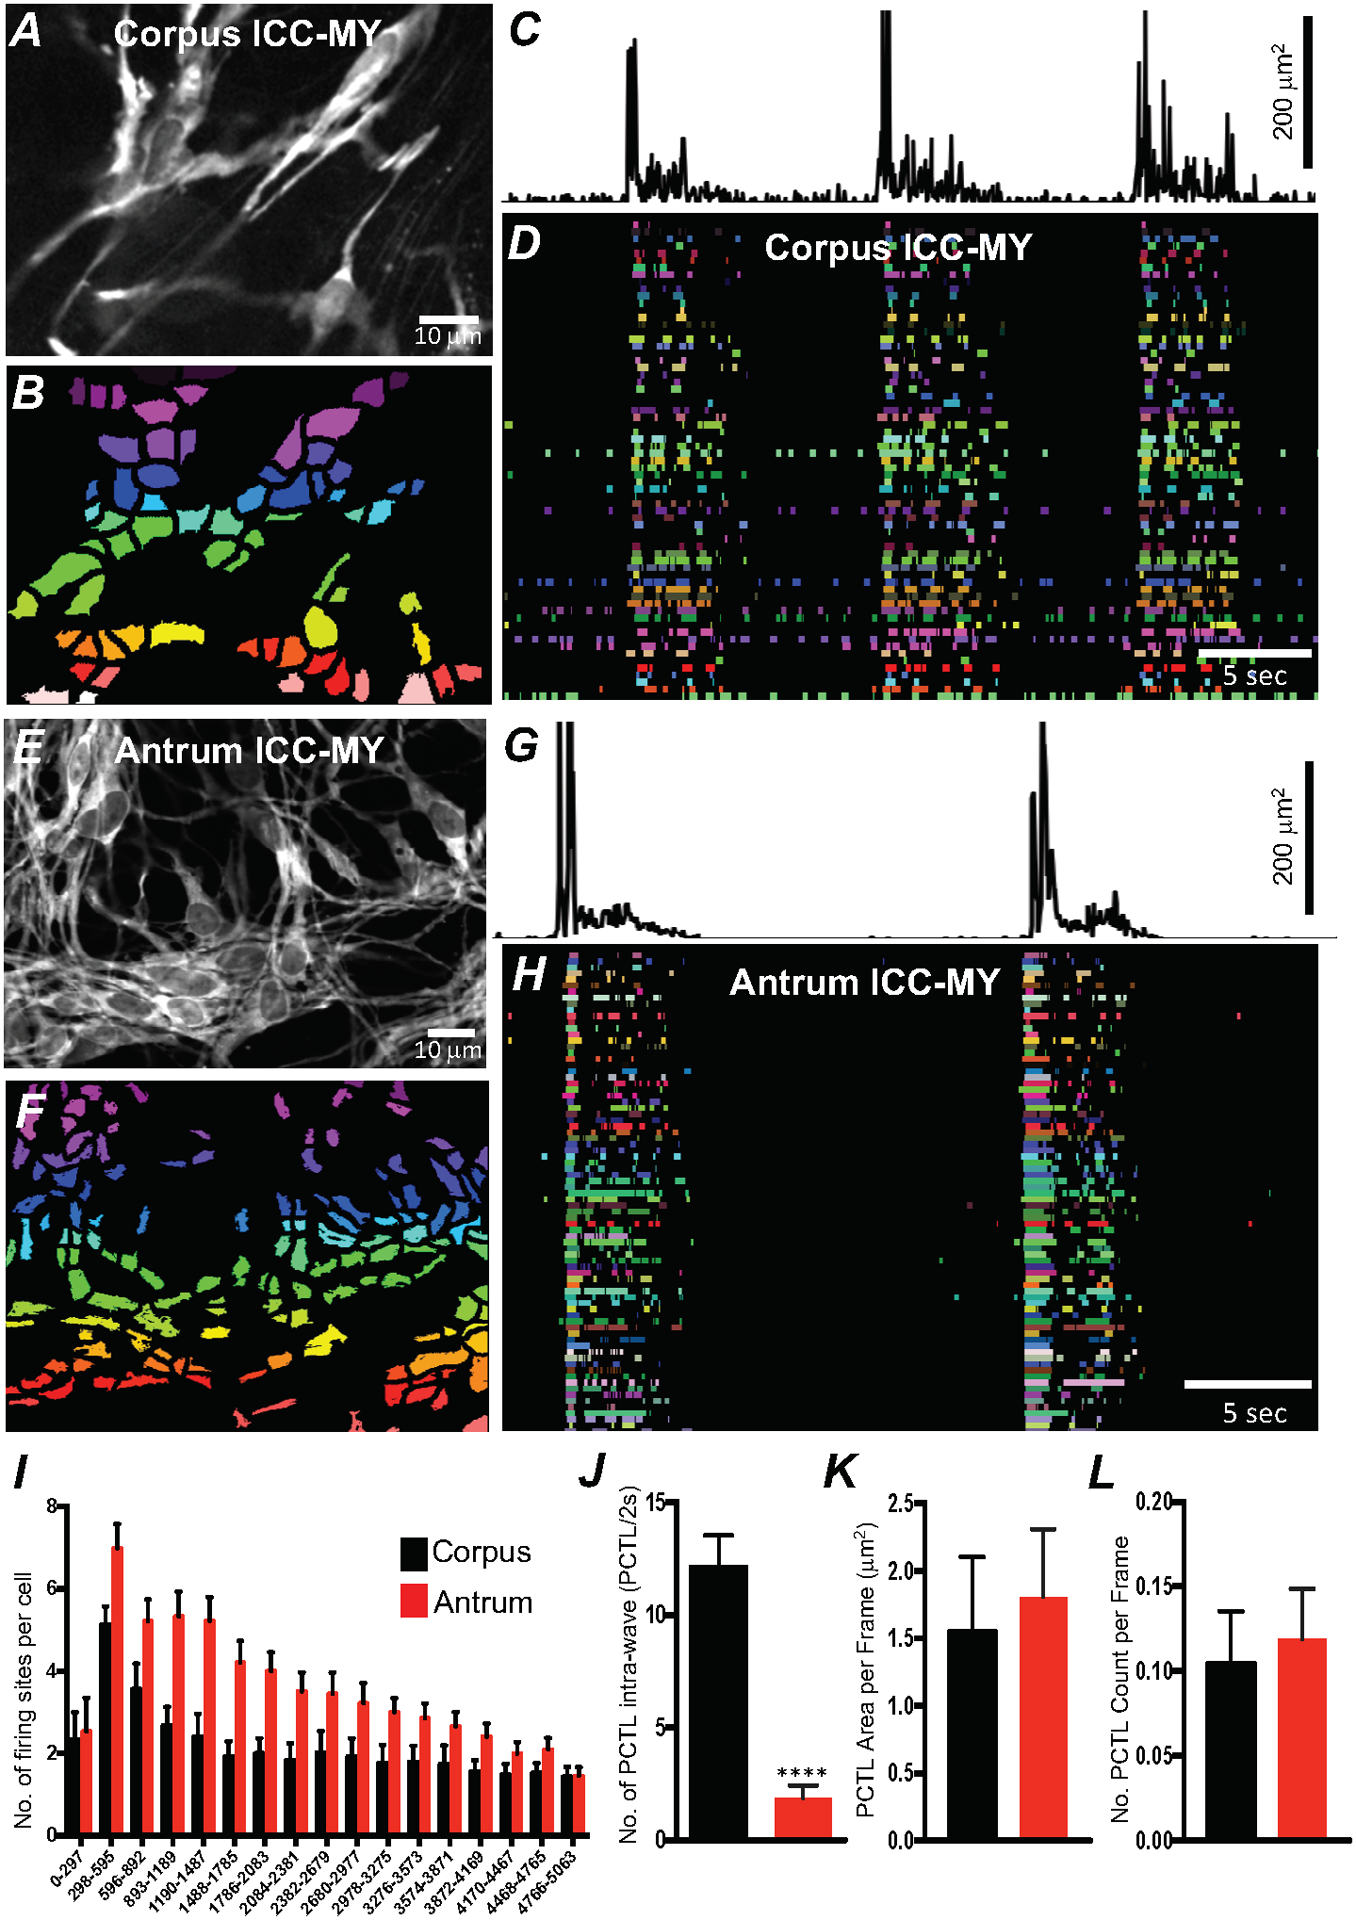
Fig. 3. Differences in Ca2+ transients firing in ICC-MY between the corpus and antrum.

A Image of an ICC-MY network from gastric corpus of a Kit-GCaMP6 mouse at 60 × magnification. B Image showing individually color-coded Ca2+ firing sites in the FOV shown in A. C Plot of total Ca2+ transients PTCLs activity from all ICC-MY Ca2+ firing sites within the FOV in the corpus. D The temporal characteristics of each individual, color-coded firing site is displayed as an occurrence map, with each “lane” representing the occurrence of firing PTCLs within each firing site. Note that multiple corpus ICC-MY Ca2+ sites fires during the intra-wave period. E Representative image of an ICC-MY network from gastric Antrum at 60 × magnification. F Image showing individually color-coded Ca2+ firing sites in the FOV shown in E (see Supplemental Movie 1). G Total Ca2+ transients activity plot from all ICC-MY Ca2+ firing sites within the FOV in the antrum. H an occurrence map, with each “lane” representing the occurrence of firing PTCLs within each firing site. Note that limited number of Ca2+ sites firing during the intra-wave period in antrum ICC-MY. I Distribution plot showing averages of firing sites number during a Ca2+ wave in ICC-MY corpus and antrum. Values are calculated for 5 s and plotted in 297 ms bins (n = 10). J Summary graph show average number of PTCL Ca2+ firing sites in ICC-MY during the intra-wave period. K & L Summary graphs show average PTCL areas and counts for Ca2+ firing sites in ICC-MY. ** = P < 0.01, n = 6. All data graphed as mean ± SEM.
