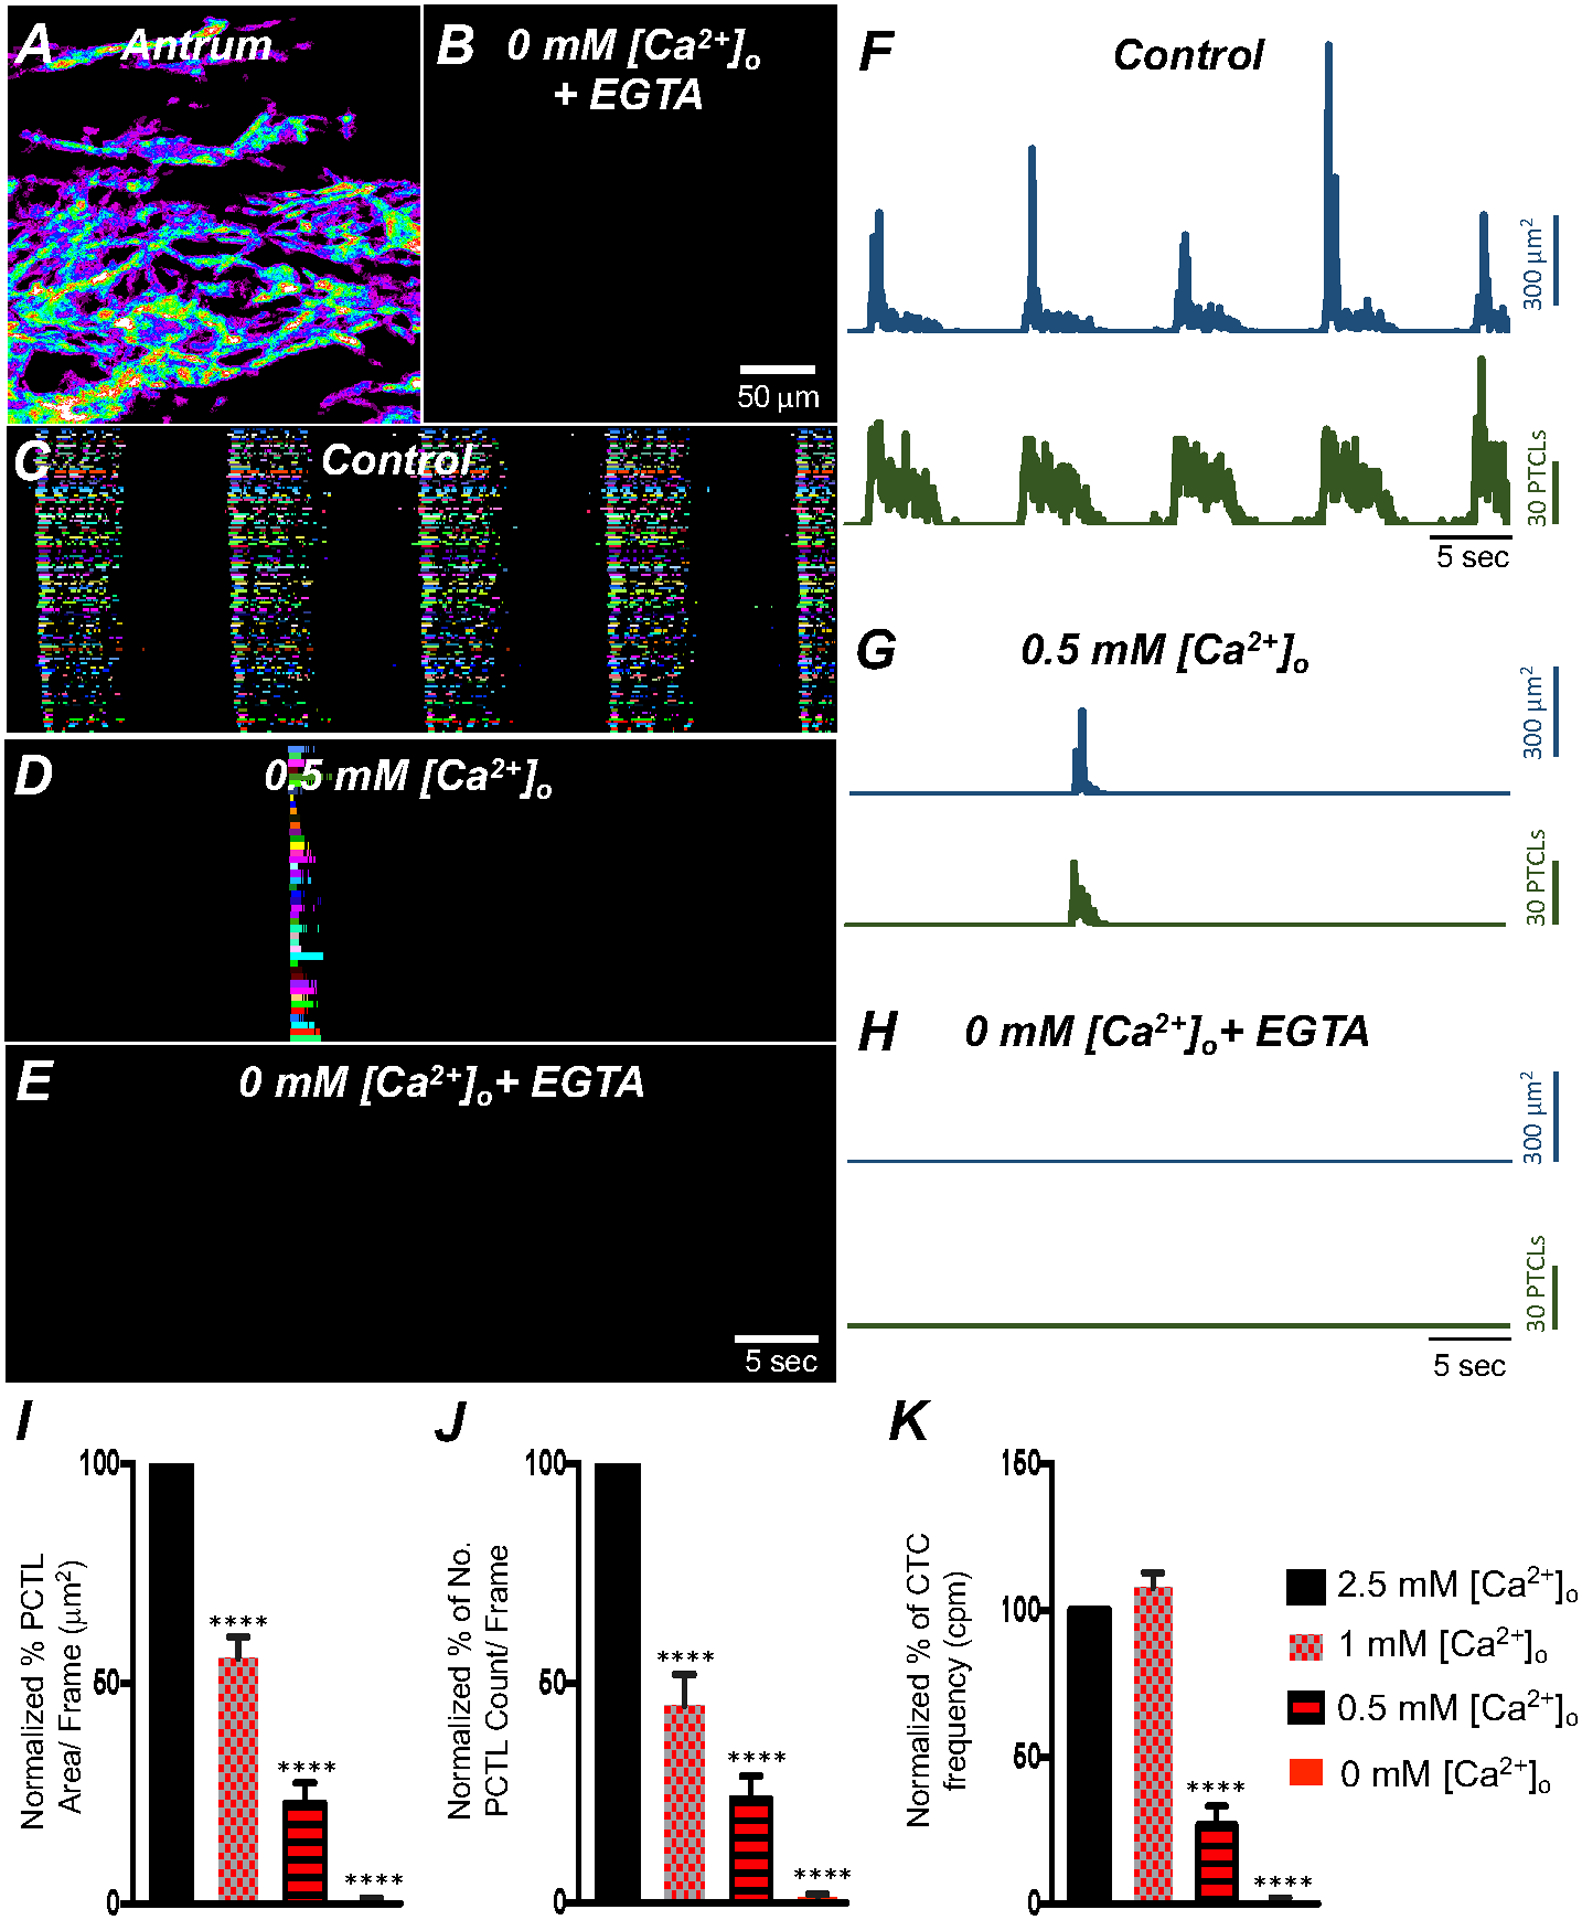
Fig. 4. Effects of extracellular Ca2+ on ICC-MY Ca2+ transients.

A Colored heat-map image of total Ca2+ transients of antrum ICC-MY under control conditions with [Ca2+]o = 2.5 mM and B after Ca2+ removal from the extracellular solution ([Ca2+]o = 0 mM and 0.5 mM EGTA). Ca2+ activity is color-coded with warm areas (white, red) representing bright areas of Ca2+ fluorescence and cold colors (purple, black) representing dim areas of Ca2+ fluorescence. Scale bar is 50 mm in both A & B. C Ca2+ transients of firing sites in ICC-MY were color-coded and plotted as an occurrence map under control conditions with [Ca2+]o = 2.5 mM. D showing the effects of reducing [Ca2+]o to 0.5 mM Ca2+. E showing the effects of removal of [Ca2+]o (final solution contain 0 mM Ca2+ and buffered with 0.5 mM EGTA). F–H Traces of Ca2+ PTCL activity in ICC-MY (PTCL area, blue and PTCL count, green) under control conditions F, in presence of 0.5 mM Ca2+ G and after removal of [Ca2+]o as shown in H. Summary graphs of Ca2+ PTCLs in ICC-MY under control conditions and with reduced [Ca2+]o to 1 mM, 0.5 mM and removal of [Ca2+]o is plotted in I (PTCL area); J (PTCL count) and K (CTC frequency). Data were normalized to controls and expressed as percentages (%). Significance was determined using one-way ANOVA, **** = P < 0.0001, n = 6. All data graphed as mean ± SEM.
