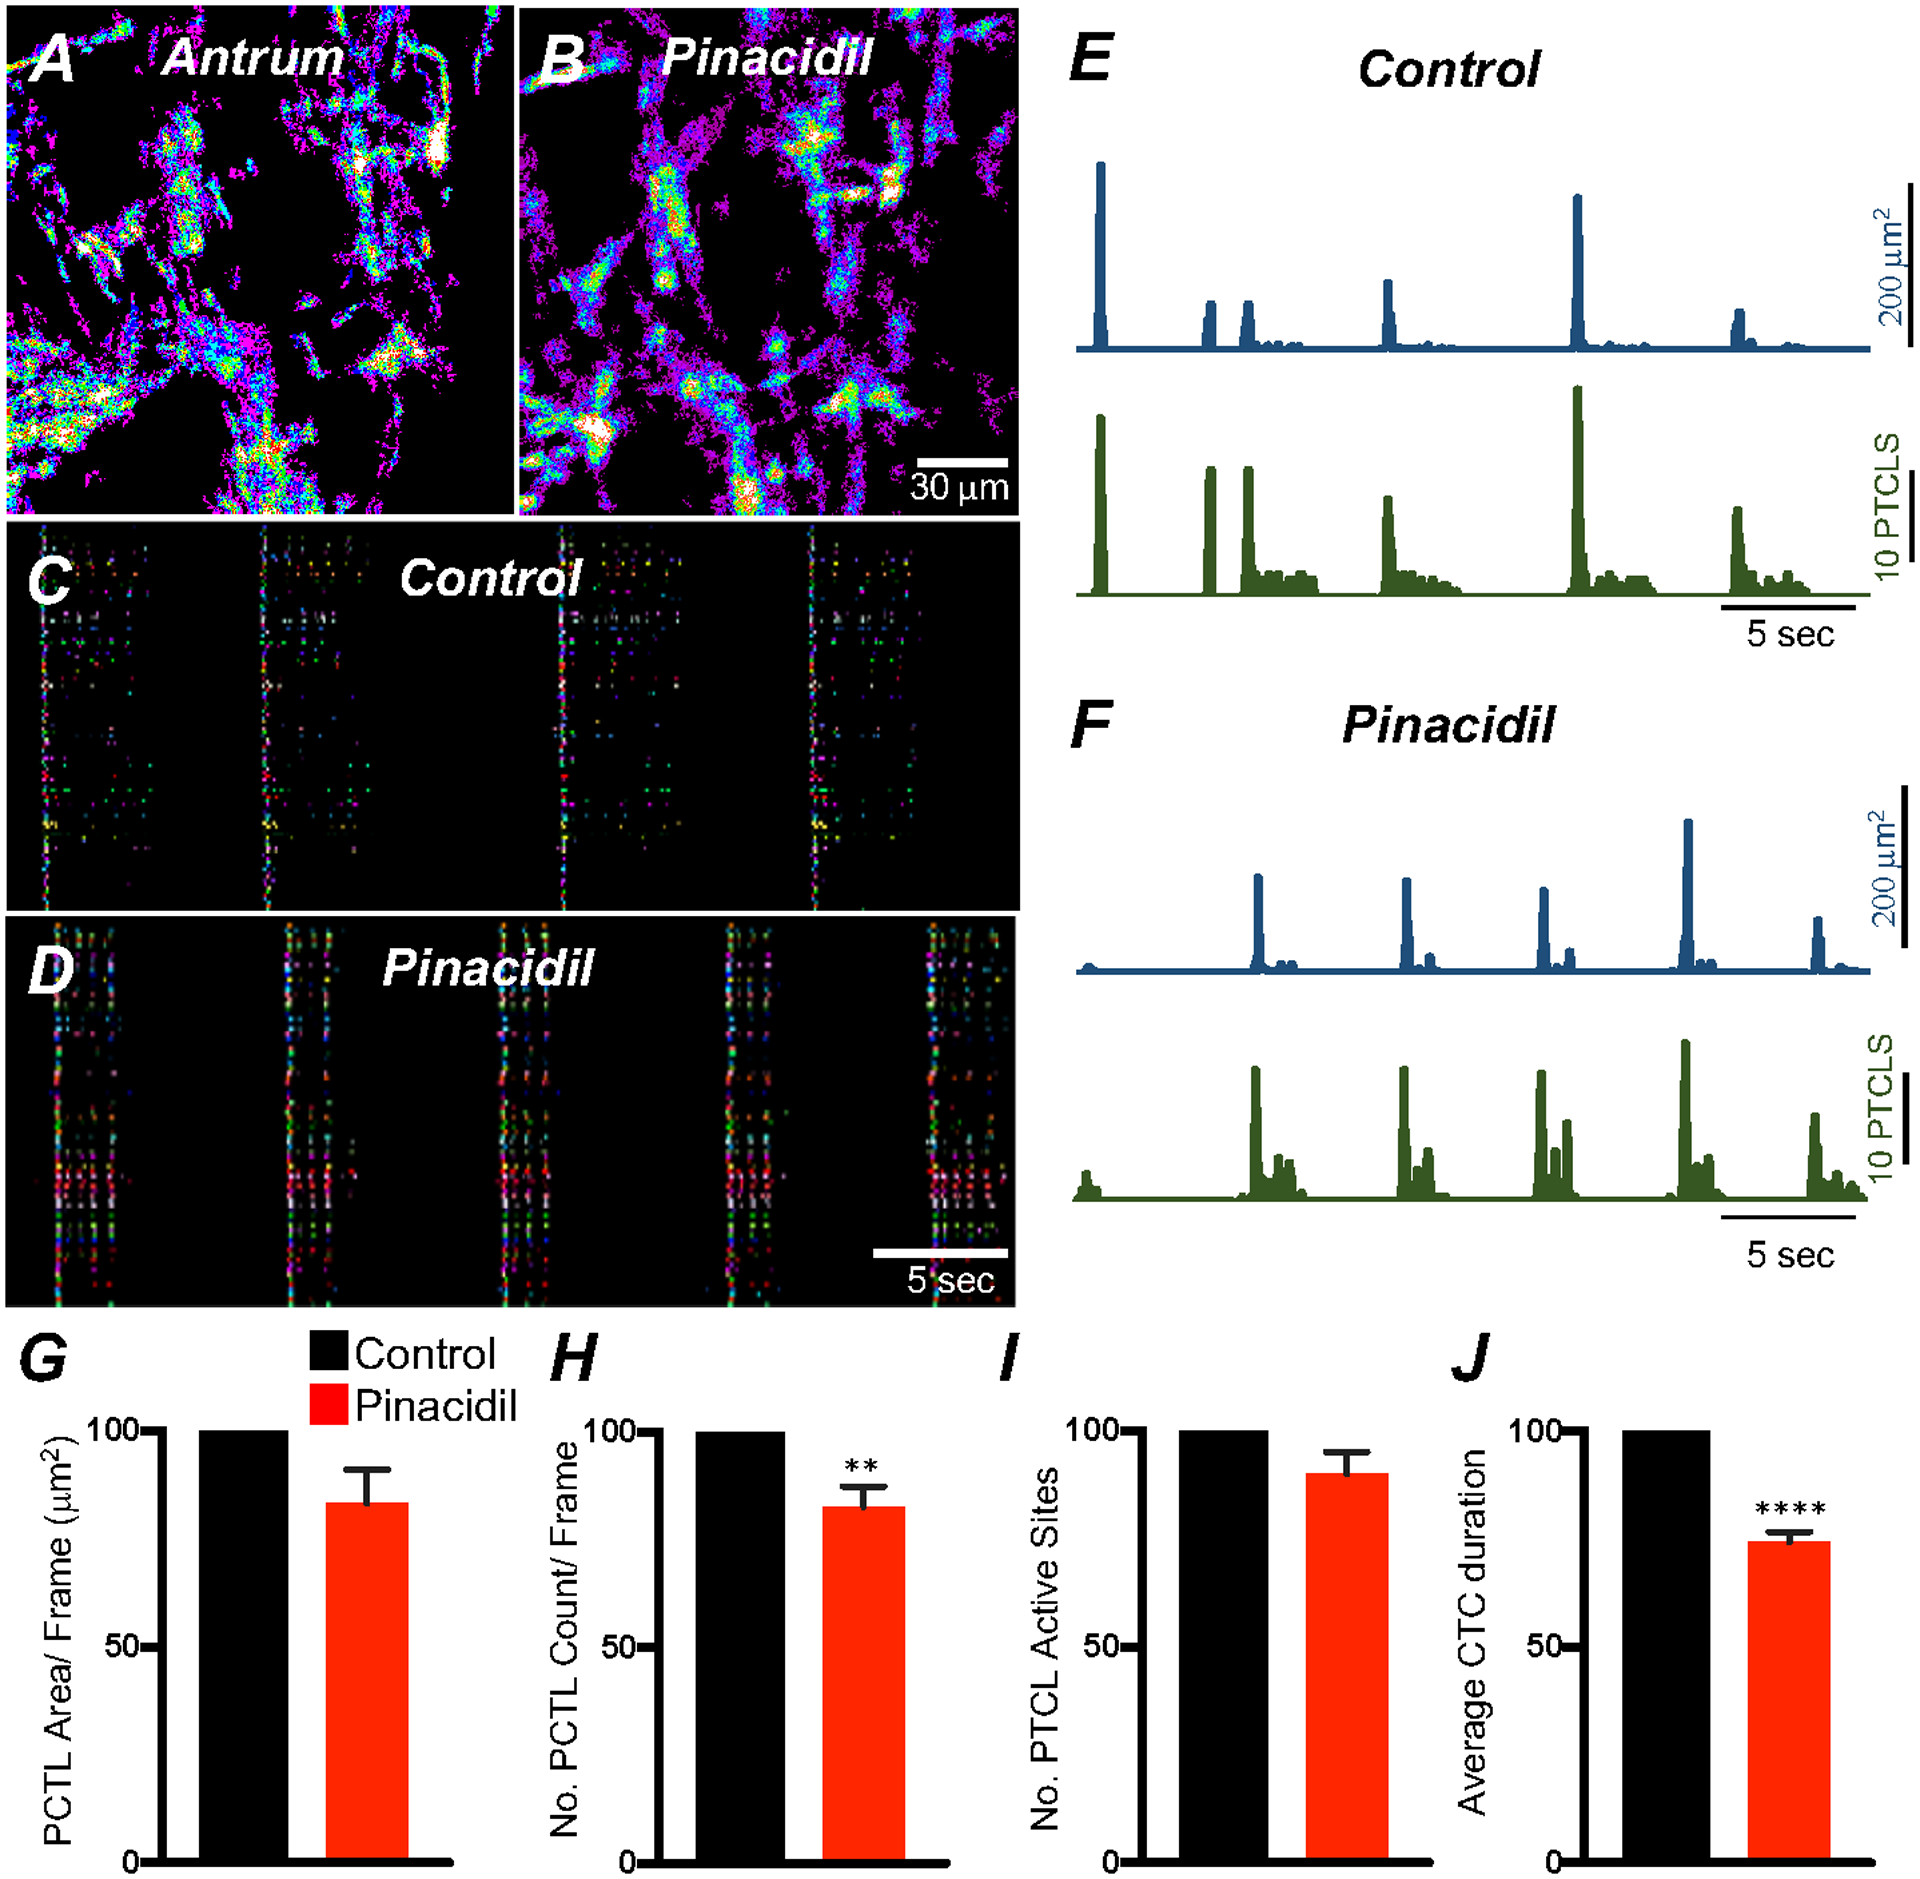
Fig. 9. membrane hyperpolarization effects on ICC-MY Ca2+ transients.

A Ca2+ Firing sites in ICC-MY are color-coded and plotted in a heat map under control conditions and in the presence of pinacidil (10 μM) B. Occurrence maps showing active firing sites under control conditions C and in the presence of pinacidil D. Trace activity of firing sites PTCL area (blue) and PTCL count (green) under each condition are shown in E&F. Summary graphs of Ca2+ PTCL activity in ICC-MY in the presence of v pinacidil are shown in G (PTCL area) and H (PTCL count). I The number of active Ca2+ PTCL and total Ca2+ transient cluster (CTC) duration in J. Data were normalized to controls and expressed as percentages (%). Significance determined using unpaired t-test, ** = P < 0.01, **** = P < 0.0001, n = 5. All data graphed as mean ± SEM.
