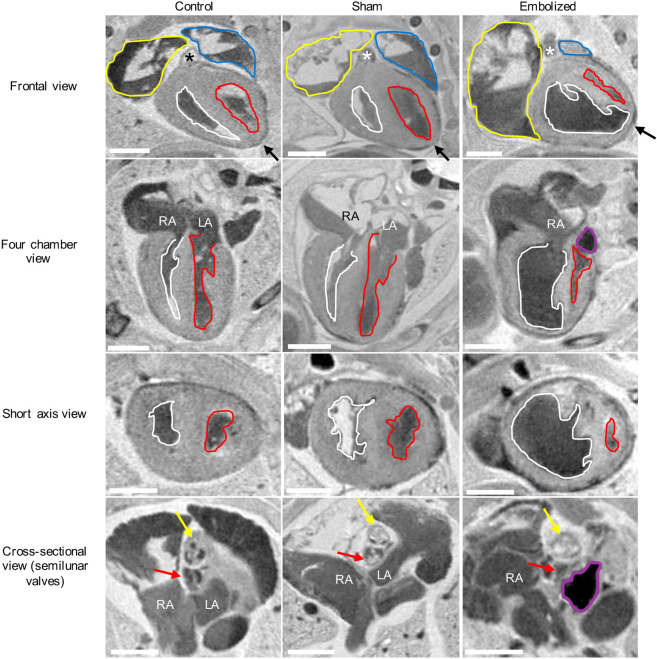
Fig. 3.
Two-dimensional MRI slices of the term fetal heart for control, sham and embolized groups. Compared to the control and sham groups, the embolized group displays severe underdevelopment of the left ventricle and the aortic valve. The yellow outlines indicate the right atrium and appendage, the blue outlines indicate the left atrium and appendage, the white outlines indicate the right ventricle, the red outlines indicate the left ventricle, and the purple outlines indicate the location of the shear thinning biomaterial (STB) embolus inside the left atrium. The asterisks denote the location of the pulmonary trunk, the black arrows indicate the location of the cardiac apex, the yellow arrows indicate the pulmonary valve, and the red arrows indicate the aortic valve. In the first three rows, the cardiac images are from a single mouse for each experimental condition. In the last row, a different mouse was used to highlight the valvular morphology due to superior image contrast. LA, left atrium; RA, right atrium. Scale bars: 1 mm.

