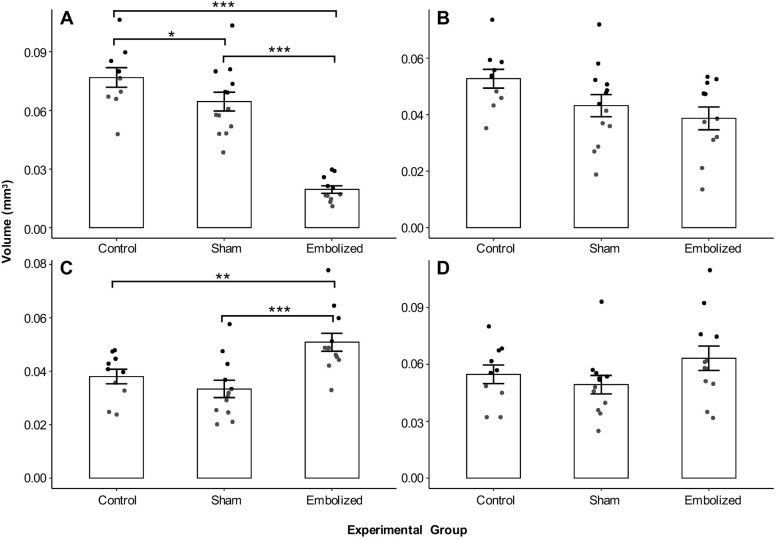
Fig. 5.
Vascular volumes derived from magnetic resonance images. (A) Ascending aorta volume (control, n=10; sham, n=13; embolized, n=11). (B) Aortic arch volume (control, n=10; sham, n=13; embolized, n=11). (C) Pulmonary trunk volume (control, n=10; sham, n=12; embolized, n=12). (D) Arterial duct volume (control, n=10; sham, n=12; embolized, n=12). The vascular volumes were modeled with a linear model (fixed effect, experimental group). For statistical analysis, one-way ANOVAs were performed on the four linear models to determine whether there was a group effect, followed by correction of these four P-values for multiple comparisons using the Bonferroni method. Post-hoc tests were performed by releveling the linear model with different experimental groups chosen as the reference group in order to evaluate all possible combinations of between-group comparisons. Data are presented as mean±s.e.m. n refers to the number of fetuses. *P<0.05, **P<0.01 and ***P<0.001.

