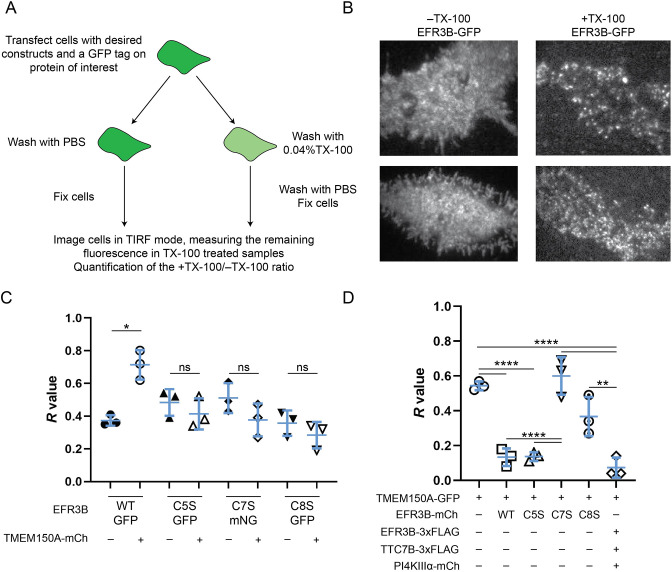
Fig. 3.
TMEM150A preferentially interacts with EFR3B(C5S) to form Complex II. (A) Diagram illustrating the workflow of the iDRM assay. All iDRM experiments were performed in RBL-2H3 cells. (B) Representative images (two per condition) of RBL-2H3 cells expressing EFR3B–GFP treated with PBS (−TX-100) or 0.04% TX-100 (+TX-100). Images are for −Tx-100 top, 22×19 µm; for −Tx-100 bottom, 28×19 µm; for +Tx-100 top, 25×21 µm; for +Tx-100 bottom, 28×20 µm. (C) Quantification of iDRM experiments on EFR3B–GFP (WT or CxS mutants) or EFR3B–mNG (for the C7S mutant) in the presence and absence of TMEM150A–mCherry (TMEM150A–mCh), with the R value (fraction of retained fluorescence) plotted. Note that WT EFR3B exhibits a strong increase in detergent resistance in the presence of TMEM150A–mCherry. However, the EFR3B(CxS) palmitoylation mutants do not. (D) Quantification of iDRM experiments on TMEM150A–GFP in the presence of EFR3B–mCherry (EFR3B–mCh; WT or indicated CxS mutants) or the indicated tagged Complex II components. In C and D, each data point represents the mean R value from 30 +TX-100 cells and 30 –TX-100 cells. Mean±s.d. of n=3 is indicated. *P<0.05; **P<0.01; ****P<0.001; ns, not significant (two-tailed unpaired t-test in C; one-way ANOVA with Tukey–Kramer post-hoc test in D).

