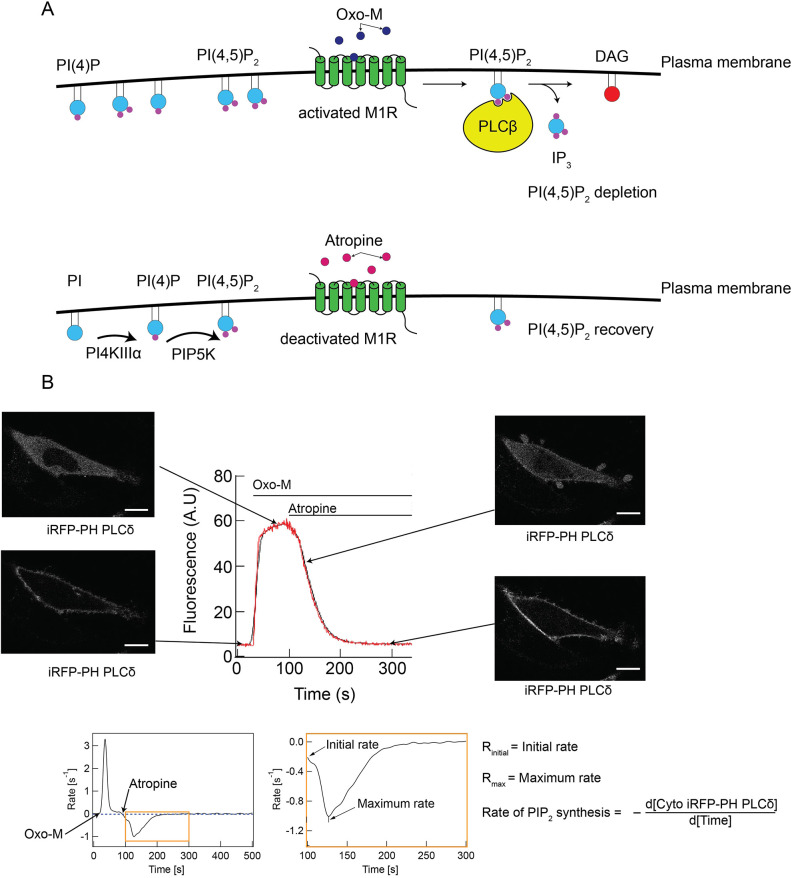
Fig. 4.
Experimental setup for studies to quantify PI(4,5)P2 recovery kinetics after acute depletion. (A) Diagram representing the M1R-mediated PI(4,5)P2 depletion system. DAG, diacylglycerol; IP3, inositol trisphosphate. (B) Top: representative curve (red line is raw data and black line is smoothed curve) depicting the cytosolic fluorescence of the PI(4,5)P2 biosensor iRFP–PH(PLCδ) over time, with corresponding confocal micrographs of a cell expressing iRFP–PH(PLCδ) at the indicated timepoints. Scale bars: 15 µm. Bottom: the rate of change of fluorescence for the cytosolic fluorescence curve shown above. The region highlighted by the orange box is shown in the expanded panel and depicts the relevant time period, post-addition of atropine, for determination of relevant kinetics parameters, which are defined on the right [initial rate of PI(4,5)P2 resynthesis and maximum rate of PI(4,5)P2 resynthesis]. A.U., arbitrary units.

