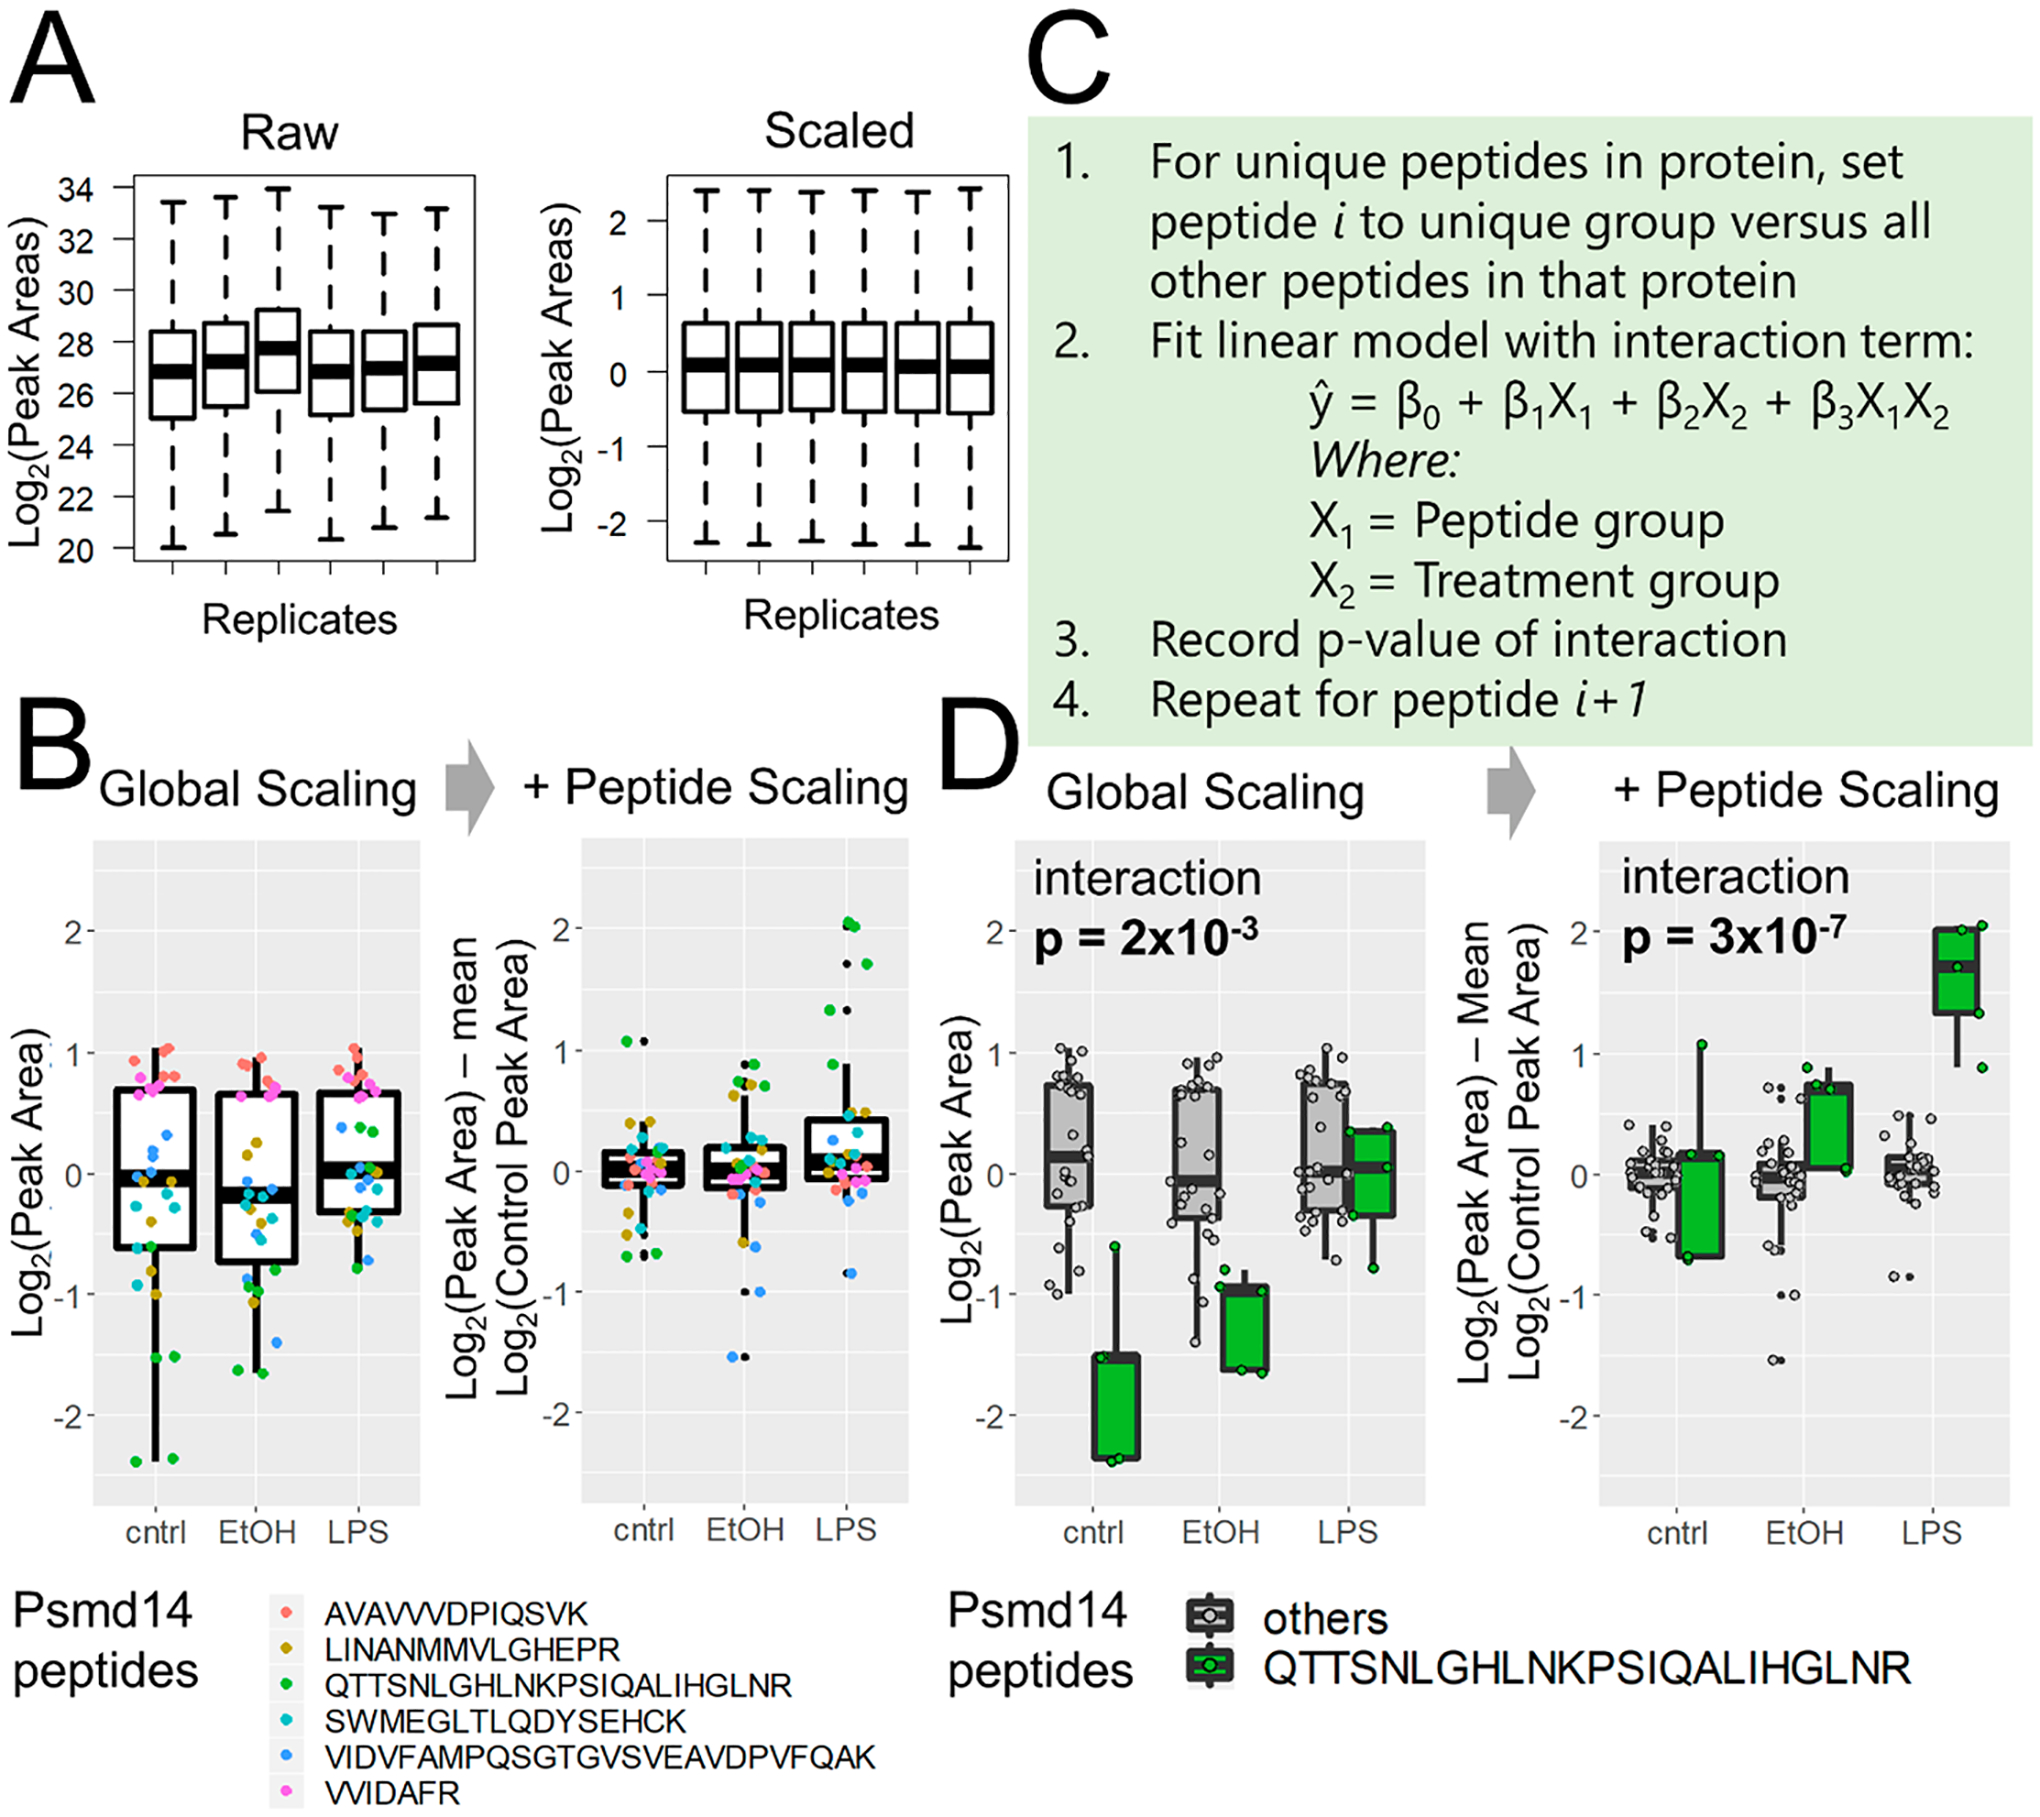
Figure 2.

Peptide correlation analysis (PeCorA) to detect differentially modified peptides. (A) First, global data distributions are scaled to be centered around zero. (B) Next, each peptide is scaled to the mean of the control group to produce a unitless relative peptide quantity across groups. This helps correct the problem of differential peptide ionization and detection efficiency to produce more uniform data distributions. (C) Third, the quantitative values of one peptide from a protein are compared with the quantities of all other peptides in that protein using a linear model with a term for the interaction between peptides and biological treatment groups. This is repeated in a loop to compare each peptide to all other peptides. The p value obtained from an ANOVA test of the interaction is used to determine whether the quantity of each peptide is statistically different from that of all other peptides in that protein. (D) Example of one peptide that is statistically different from the quantities of all other peptides. The p value of the interaction between the peptide and the treatment group decreases when peptide scaling aligns the data.
