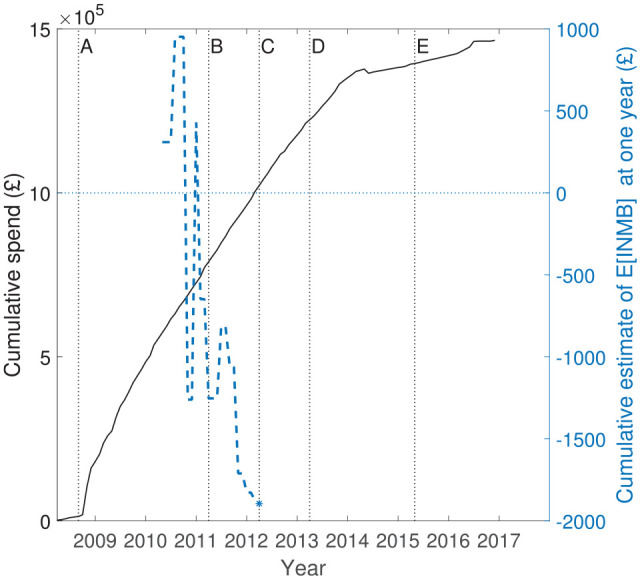
Figure 2.

Cumulative budget spend for the ProFHER trial (left axis, continuous line) and average of incremental net monetary benefit at 1 year (right axis, dashed blue line, plotted in blocks of 10 patient pairs, 10 receiving surgery and 10 receiving sling). Key milestones: ‘A’– recruitment starts; ‘B’– recruitment finishes; ‘C’– 1 year follow-up finishes; ‘D’– 2 year follow-up finishes; ‘E’– publication of principal articles.17,18
