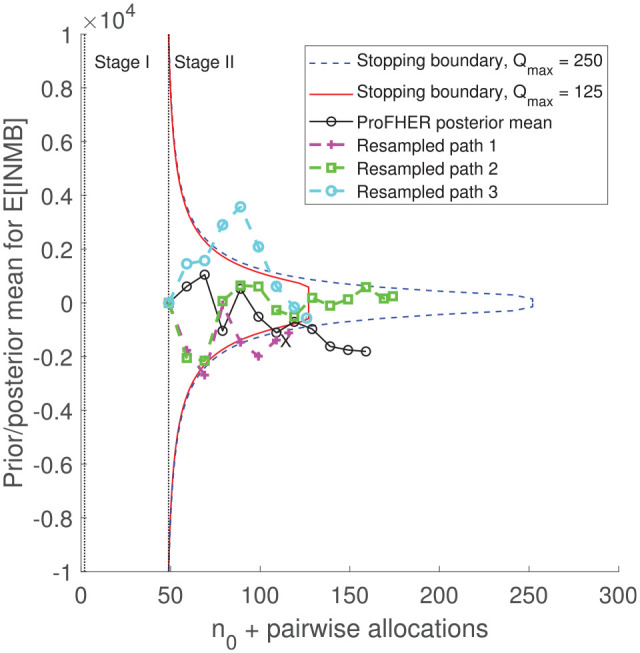
Figure 3.

Stopping boundaries for the two versions of the model, together with the path for the posterior mean generated using the trial’s data (black line, marker: ‘°’) and three resampled paths from the bootstrap analysis (dashed lines, markers: ‘+’, ‘□’ and ‘°’). X marks the first interim analysis at which the posterior mean lies outside the stopping boundary (for both versions of the model).
