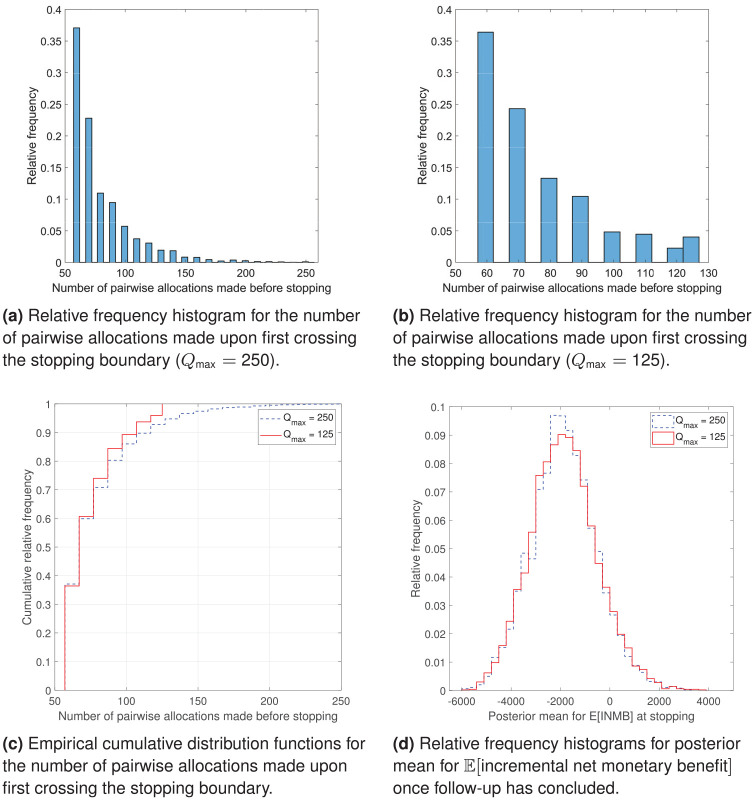
Figure 4.
Graphical analysis of the bootstrap results: (a) relative frequency histogram for the number of pairwise allocations made upon first crossing the stopping boundary , (b) relative frequency histogram for the number of pairwise allocations made upon first crossing the stopping boundary , (c) empirical cumulative distribution functions for the number of pairwise allocations made upon first crossing the stopping boundary and (d) relative frequency histograms for posterior mean for once follow-up has concluded.

