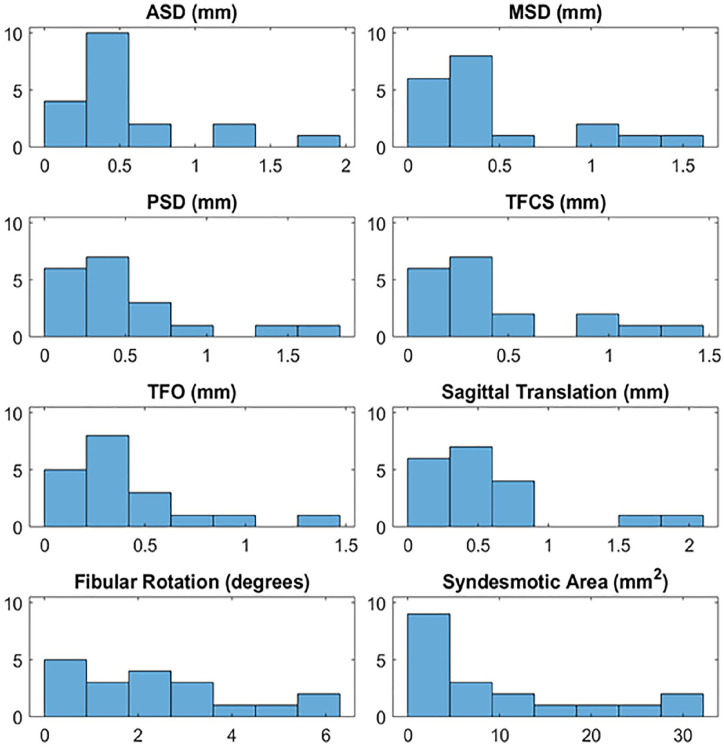
Figure 6.
Distribution of side-to-side differences in syndesmotic motion between dorsiflexion and plantarflexion. The y-axis indicates the number of patients, and the x-axis indicates the value for each syndesmotic measurement. ASD, anterior syndesmotic distance; MSD, middle, syndesmotic distance; PSD, posterior syndesmotic distance; TFCS, tibiofibular clear space; TFO, tibiofibular overlap.

