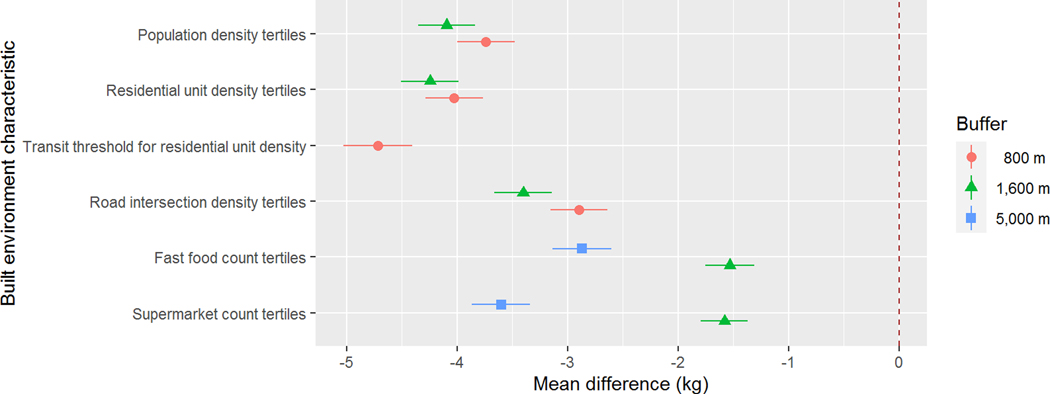
Figure 2.
Mean difference in weight at baseline comparing the first and third tertiles of built environment characteristics at different buffer sizes, after adjusting for baseline demographics, height, and year-specific patient property values
Note: All densities are calculated as units per hectare. Models adjust for sex at birth (male and female), baseline age (nonlinearly via spline terms with 10 DF), race/ethnicity (non-Hispanic White, non-Hispanic Black, Hispanic, non-Hispanic Asian, Hawai’ian / Pacific Islander, Native American / Alaskan Native, and Other), Medicaid (yes/no), and baseline height (nonlinearly via spline terms with 5 DF, allowing association to differ by sex at birth), and patient residential property values. Separate models were fit for each BE variable. Models for fast food and supermarket counts at 1,600 m are binary comparisons of any vs. none, not tertiles. The model for transit threshold for residential unit density is also binary at the transit threshold: 18 units/hectare in 800 m.

