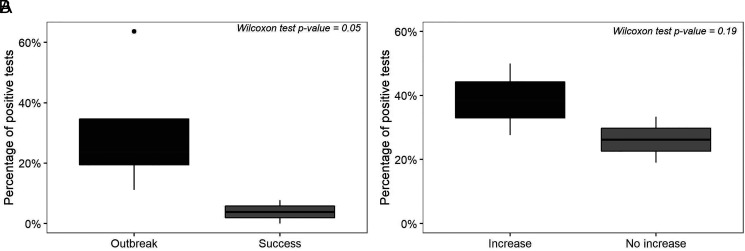
Figure 6.
Wilcoxon rank test’s graphical representation. (A) Differences among positive tests percentage and epidemiological weeks classified as Outbreak and Success. (B) Differences among positive tests percentage and epidemiological weeks preceding a worsening epidemiological classification shift.

