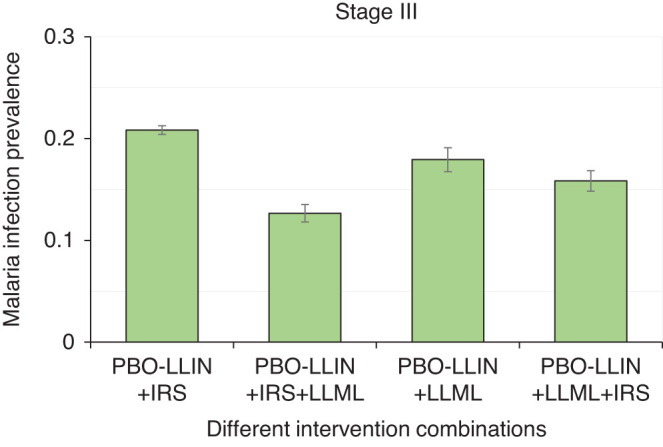
Figure 5.

Simulated mean malaria infection prevalence rate under different intervention scenarios during stage III interventions. Error bar was standard deviation. PBO-LLIN, piperonylbutoxide-treated LLIN; PBO-LLIN+LLML, PBO-LLIN plus long-lasting microbial larviciding; PBO-LLIN+LLML+IRS, PBO-LLIN plus LLML and then indoor residual spraying; PBO-LLIN+IRS, PBO-LLIN plus indoor residual spraying; PBO-LLIN+IRS+LLML, PBO-LLIN plus IRS and then LLML. This figure appears in color at www.ajtmh.org.
