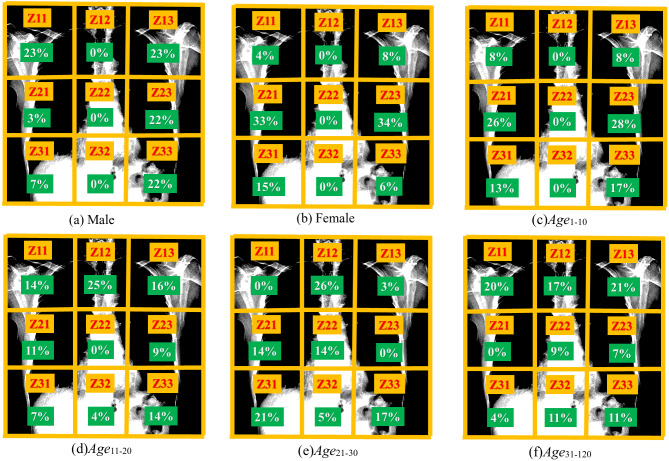
Figure 9. The graphs show the attention of the models in each zone to learn the features for the classes (A–F).
The higher bars show that the model is focusing more on that particular zone to learn features. For instance, the gender detection model pays more attention to learn features for class Male at Z11 and Z13. Similarly, the model pays most attention at Z11 and Z13 to learn features for class Age31–120.

