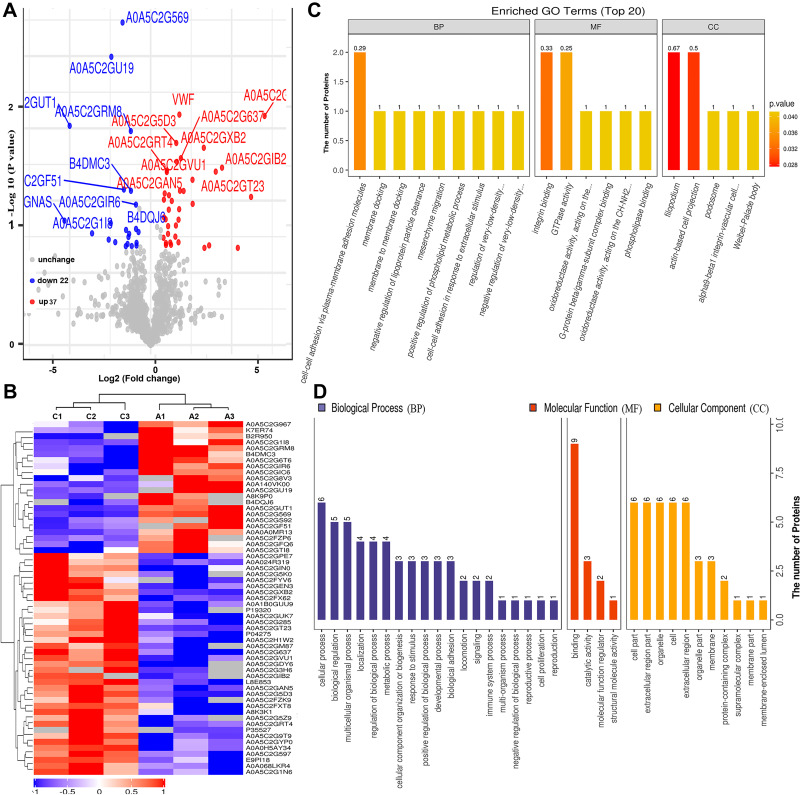
Figure 3.
Bioinformatics analysis of differentially expressed proteins between the serum samples of the healthy controls and those of HBV-genotype C infected patients. (A) Volcano plot representing the protein abundance changes (groups C vs A). A total of 59 dysregulated proteins with fold change ≥±1.5 and p-values < 0.05 were identified. (B) Hierarchical clustering of the 66 dysregulated proteins (groups C vs A). (C) GO analysis of 59 dysregulated proteins (groups C vs A). The abscissa represents enriched GO function classifications, which were divided into three major categories: biological process (BP), molecular function (MF) and cellular component (CC). (D) KOG analysis of 59 dysregulated proteins (groups C vs A).

