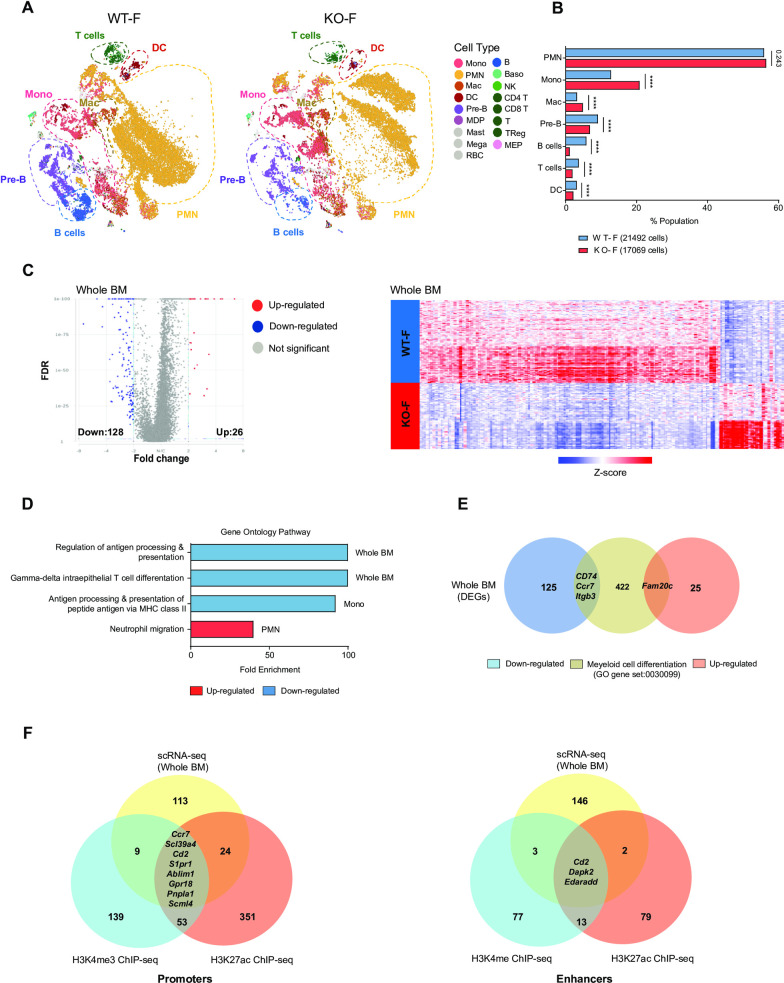
Fig 6. The loss of Kdm6a alters gene expression in normal hematopoiesis.
(A) t-distributed stochastic neighbor embedding (t-SNE) plots of single cell RNA-seq (scRNA-seq) data from whole BM cells of WT-F mice (n = 2, total cells: 21492) and KO-F mice (n = 2, total cells: 17069). (B) Population fractions in whole BM cells from KO-F and WT-F mice associated with the scRNA-seq data as defined by Haemopedia gene expression. Cell populations shown include: PMNs, monocytes, macrophages, Pre-B cells, B cells, T cells and DCs. (C) Volcano plots of expression changes of KO-F vs. WT-F from whole BM (FDR < 0.01, FC: > 2 and <-2). Heatmap of z-score values of 154 differentially expressed genes (DEGs) from KO-F mice compared to WT-F mice by scRNA-seq. (D) Gene ontology (GO) pathway analysis for all DEGs in whole BM, PMNs, and monocytes.(E) Venn diagram showing the overlap between all DEGs of whole BM and the Myeloid cell differentiation GO gene set (0030099). (F) Venn diagram showing the overlap between all DEGs of the whole BM scRNA-seq and Chip-seq data for H3K4me3 and H3K27ac promoters (left panel) or H3K4me and H3K27ac enhancers (right panel). Error bars represented mean ± s.d. ****p<0.0001 by Fisher’s exact test with multiple hypothesis corrections.

