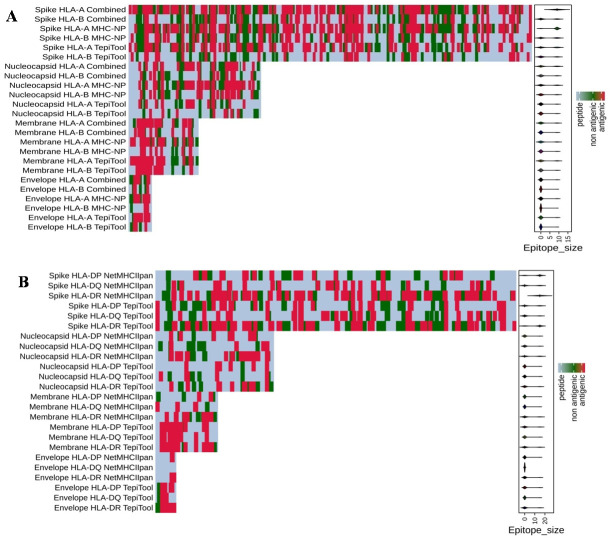
Fig 5. Summary of SARS-CoV-2-derived T-cell epitopes.
Heat map showing the distribution of (a) HLA class I and (b) HLA class II epitopes across the protein sequences of spike (1273 aa), nucleocapsid (419 aa), membrane (222 aa), and envelope (75 aa) proteins of SARS-CoV-2. Red color represents antigenic epitopes predicted using the methods described in Fig 1.

