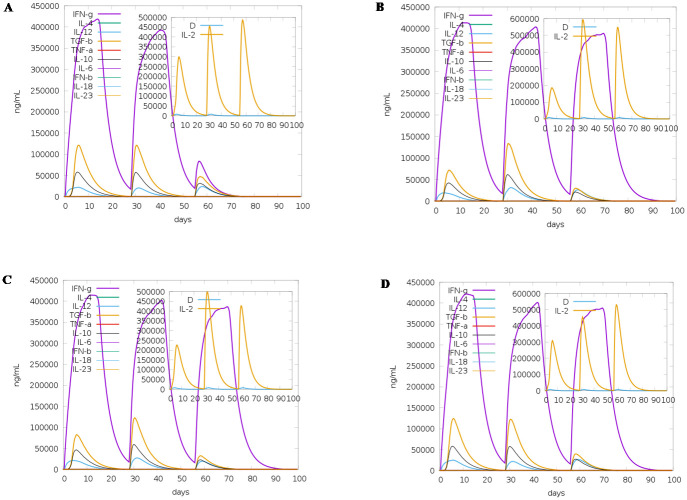
Fig 7. In silico immune simulation of multi-epitope vaccine constructs of SARS-CoV-2.
C-ImmSim simulation of the cytokine levels induced by three injections administered four weeks apart. The main plot shows cytokine levels after the injections. The inset plot shows IL-2 levels with the Simpson index (D), which is indicated by the dotted line, is a measure of diversity. Increase in D over time indicates the emergence of different epitope-specific dominant clones of T cells. The smaller the D value, the lower the diversity. (a) The receptor-binding domain (RBD) of the spike (S) protein (B- and T-cell epitopes); (b) The S protein (B- and T-cell epitopes); (c) The structural protein construct (B- and T-cell epitopes of S, N, M, and E proteins); (d) The chimeric construct of S and N proteins (B- and T-cell epitopes of S and N proteins).

