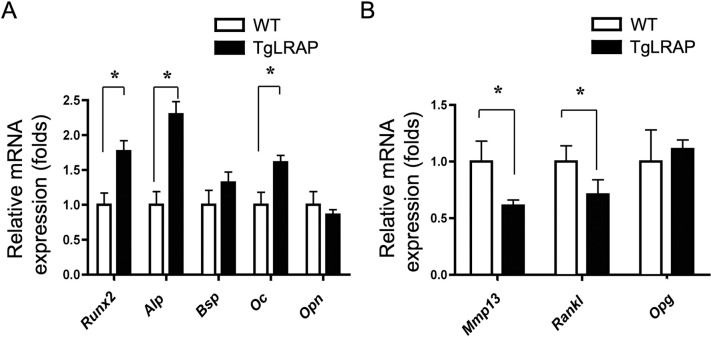
Fig 4. Altered gene expression levels in LRAP transgenic calvarial cells using Q-PCR.
The empty or solid column represents the mRNA expression of WT or TgLRAP calvarial cells examined, respectively. A, Bone formation markers. B, Bone resorption makers. The experiments were repeated 3 times. Each column represents the mean ± SD. *p<0.05. WT; wild-type mouse, TgLRAP; LRAP transgenic mouse.

