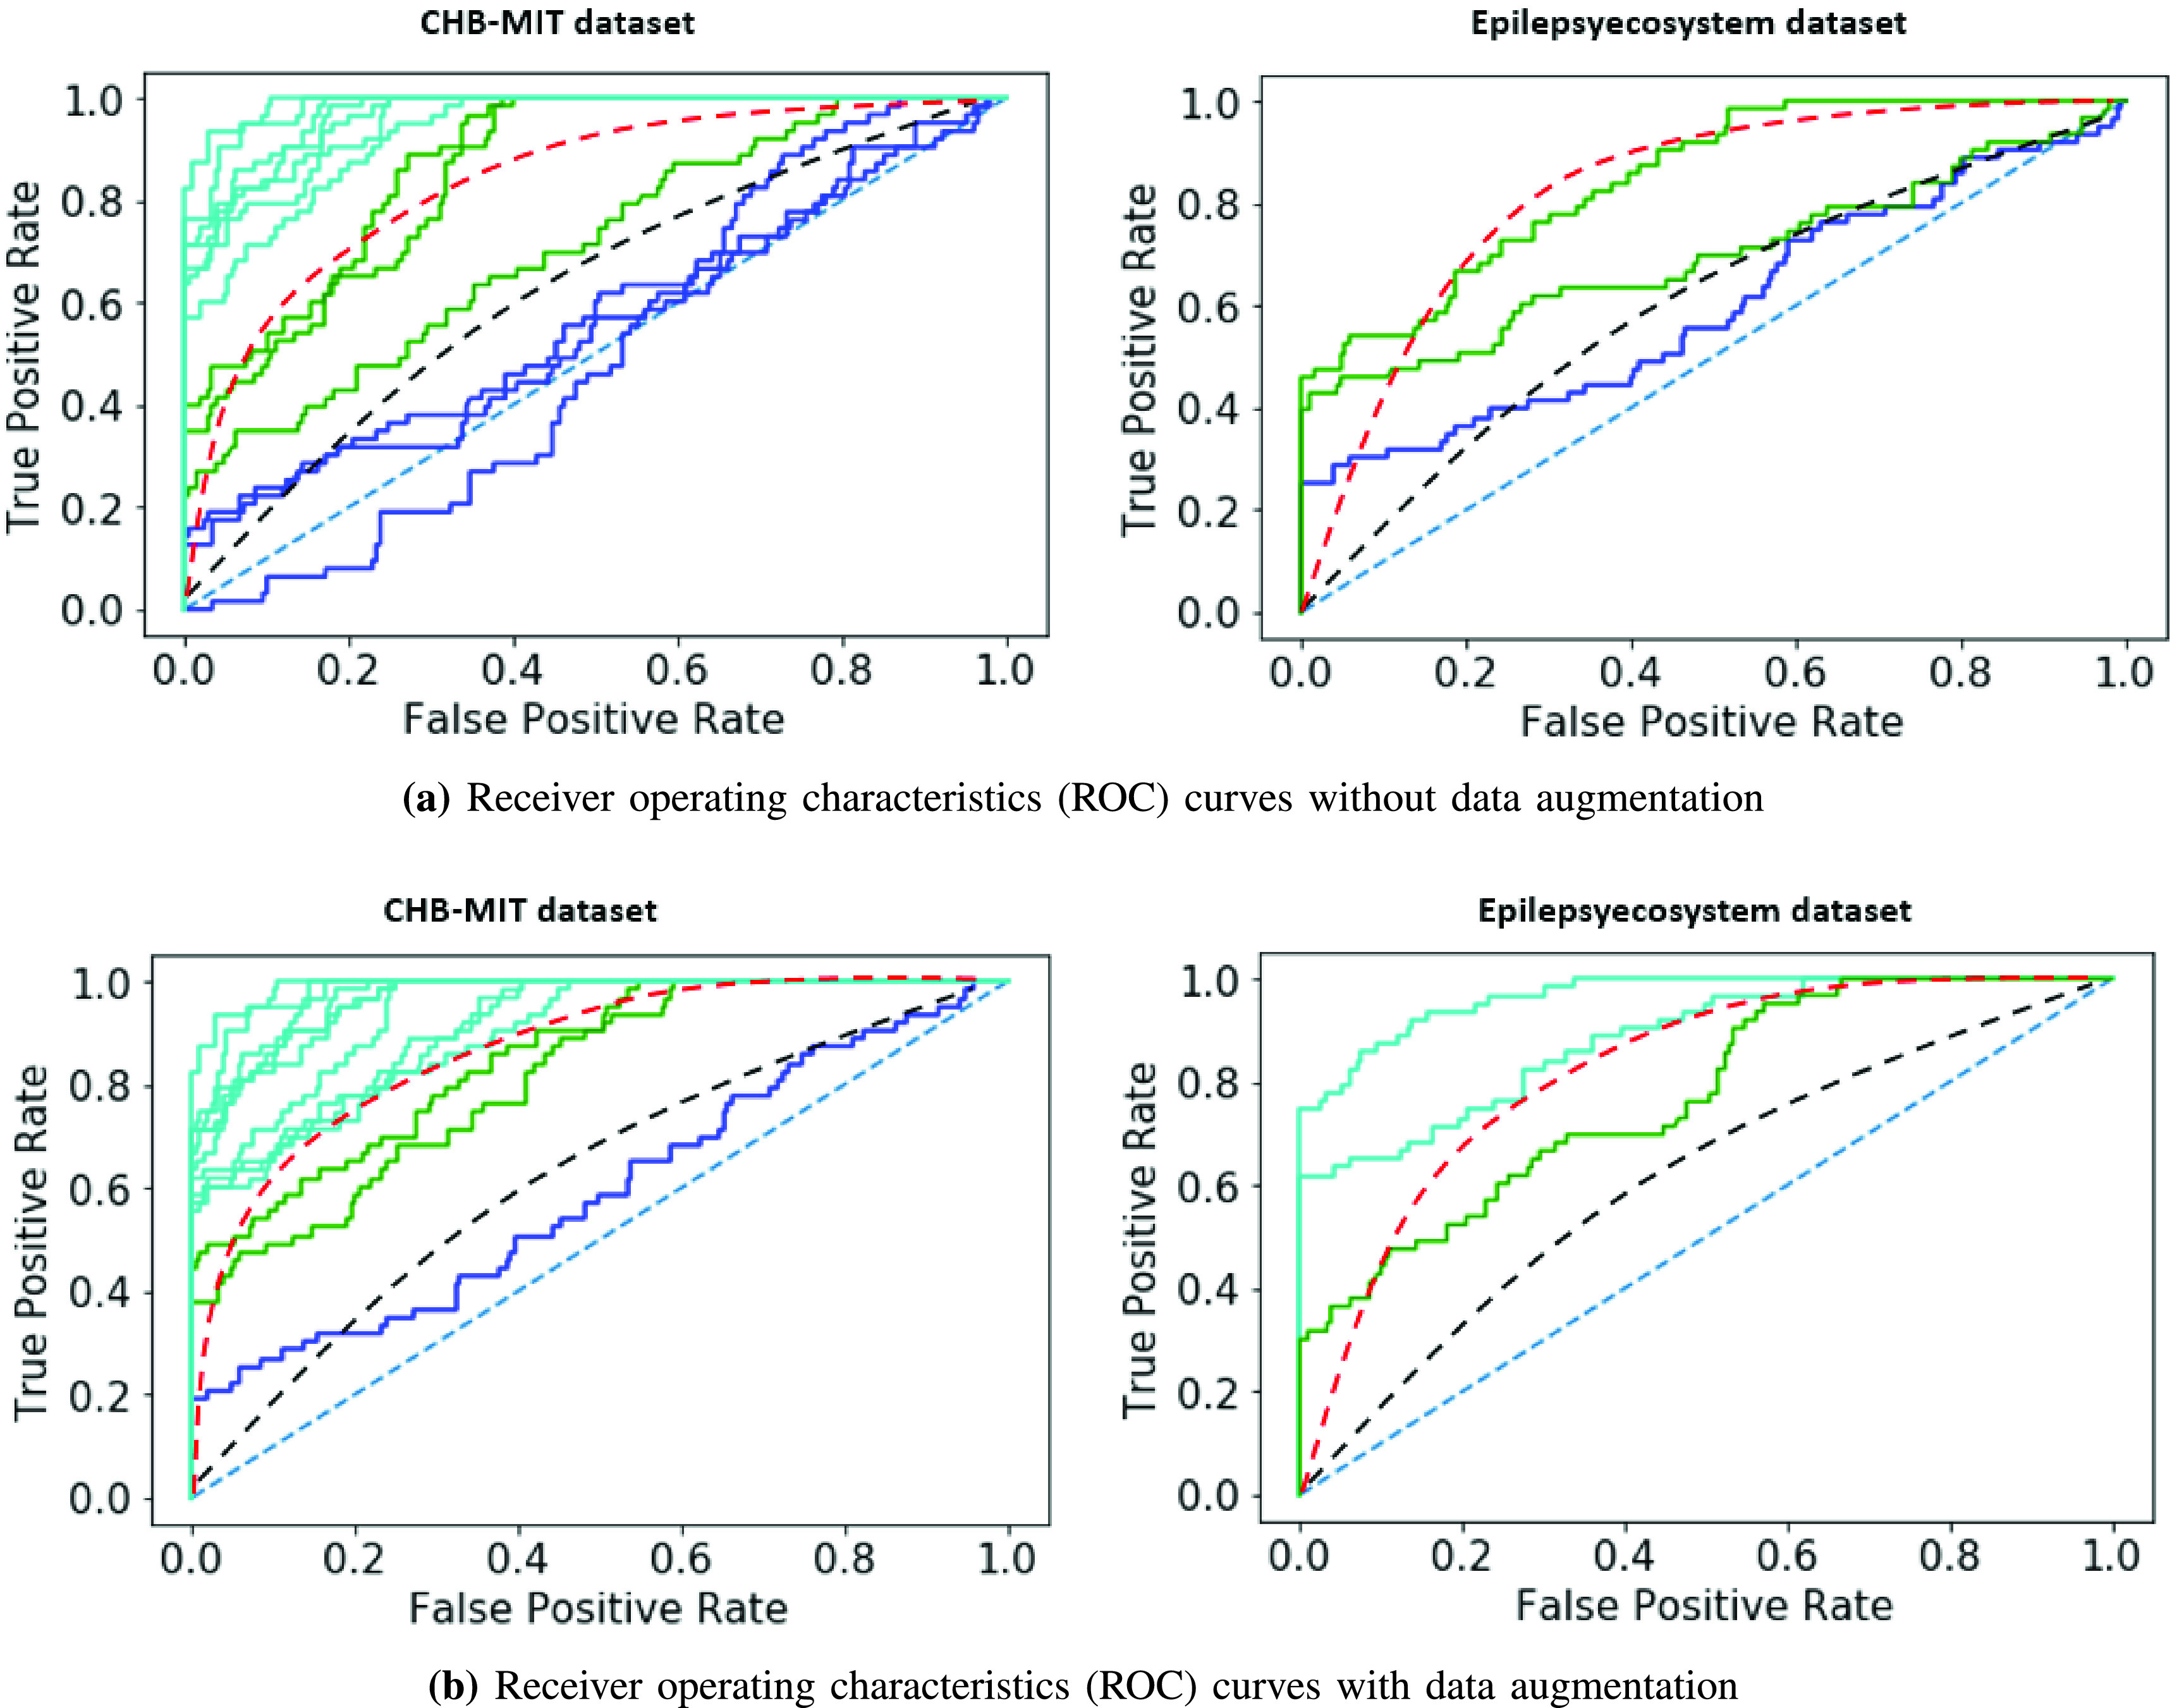
Fig. 4.

Receiver operating characteristics (ROC) curves of ES prediction performance testing for two datasets with and without augmentation: (a) without augmenting the datasets (b) with data augmentation using the synthetic samples from DCGAN. In these curves, each line represents a patient. Above the black dash line: good prediction performance; above the red dash line; very good prediction performance (adapted from [31]).
