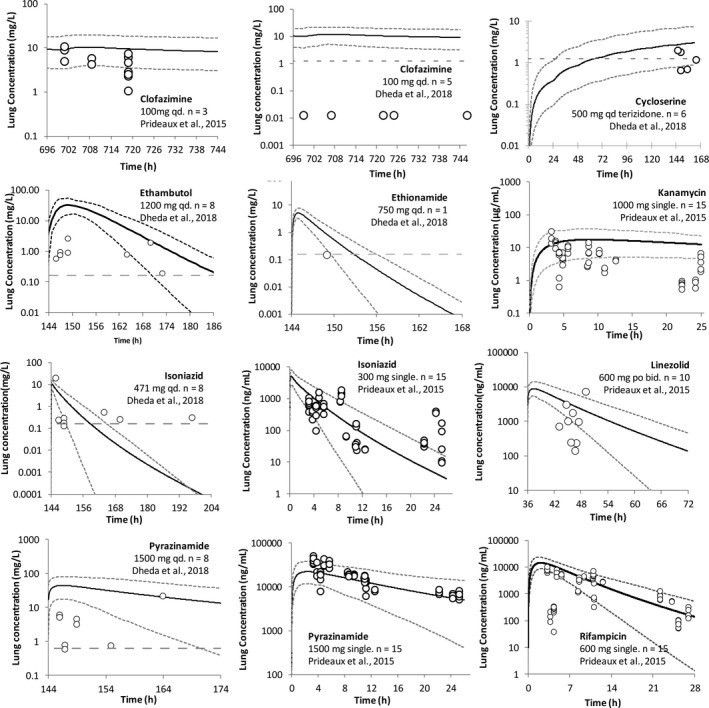
FIGURE 5.

Simulated versus observed concentration in lung tissue mass over time for nine drugs administered to patients with tuberculosis (TB). Simulated (lines) and observed (data points) lung concentration over time for clofazimine, cycloserine, ethambutol, ethionamide, kanamycin, isoniazid, linezolid, pyrazinamide, and rifampicin. The observed data were obtained from Prideaux et al. 15 (linezolid and kanamycin published by Strydom et al. 16 ) and Dheda et al. 17 The n represents the number of patients with TB. Simulated data are from the right lung (RL) compartment and are after the final dose at steady state, except where indicated as single dose (kanamycin, isoniazid, pyrazinamide, and rifampicin). The short dashed lines represent the 5th and 95th percentile of the prediction in the total virtual population (10 trials of 15 healthy volunteer population, 23–59 years, 33% women for the Prideaux et al. 15 study; 10 trials of 12 Black South African TB population, 23–50 years old, 67% women for the Dheda et al. 17 study)
