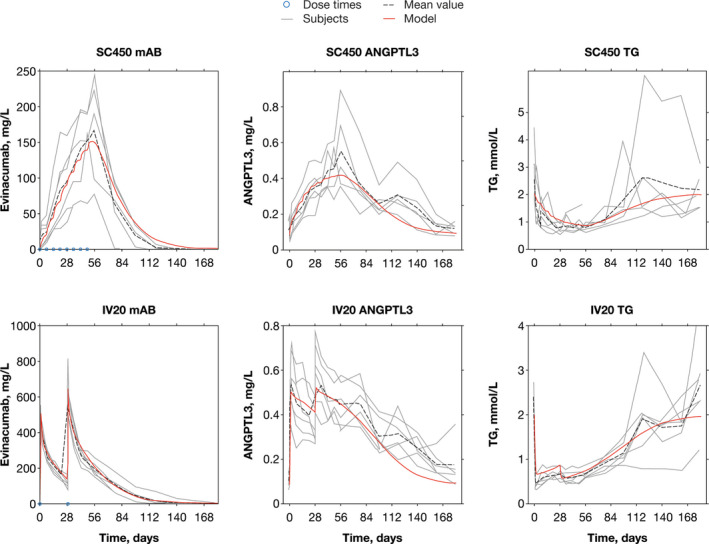
FIGURE 6.

Quantitative systems pharmacology model simulation (red) overlaid on evinacumab clinical trial data for selected subjects. The solid red line represents the quantitative systems pharmacology model simulation, the dashed black line represents the mean value of observed clinical trial data, and the solid gray lines represent individual participant data. The blue dots represent evinacumab dosing, which was consistent across all separate IV and SC panels. Evinacumab clinical data taken from a phase I, multiple ascending dose study with evinacumab in subjects with hypertriglyceridemia (NCT02107872). The subjects were selected to show both SC and IV dosing at the higher evinacumab dose levels. ANGPTL3, angiopoietin‐like protein 3; IV, intravenous, mAb, monoclonal antibody; SC, subcutaneous; TG, triglyceride
