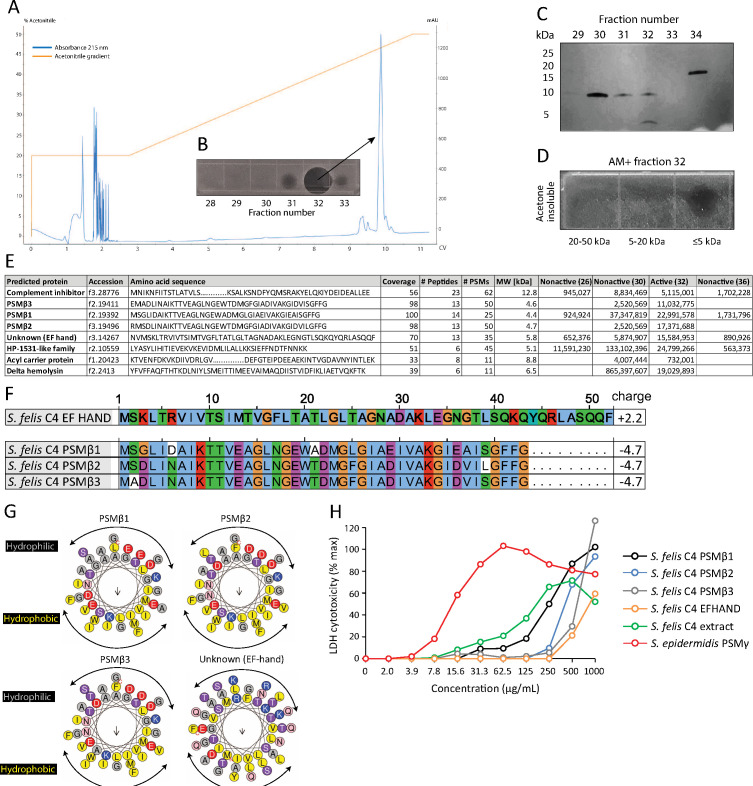
Figure 2. HPLC purification yields an antimicrobial fraction from S. felis C4 supernatant.
(A) Reverse-phase high-performance liquid chromatography (HPLC) elution profile from sterile supernatant of S. felis C4 strain loaded onto a C8 column. (B) Inset image of antimicrobial activity exhibited by fraction 32 against S. pseudintermedius ST71 corresponding to the indicated peak. (C) Silver stain of total protein content in the different fractions indicated. (D) Radial diffusion assay of antimicrobial activity of the AM + fraction 32 after extraction and acetone precipitation of proteins within different sized silver stain gel fragments. (E) Mass spectrometry (MS) table of the top eight peptide hits obtained from HPLC fractions that were active (fraction 32) or inactive (26, 30, 36) against S. pseudintermedius ST71. (F) ClustalW multiple amino acid sequence alignment of all three S. felis C4 genetically-encoded PSMβ peptides with predicted net charge at pH 7.4 (Prot pi) and amino acid sequence of a EF-hand domain-containing peptide with unknown function. (G) Alpha helical wheel plots of S. felis C4 PSMβ1–3 and EF-HAND domain peptide, indicating conserved α-helical, amphipathic-like structures with indicated hydrophobic yellow residues confined to one side (indicated by arrow) and gray hydrophilic residues on the opposing side. (H) LDH release in NHEKs after 24 h treatment with increasing concentrations of S. felis C4 extract, S. felis C4 EF-HAND synthetic peptide, S. felis formylated synthetic PSMβ1, PSMβ2, PSMβ3, or positive control cytotoxic PSMγ from S. epidermidis. Percentage (%) cytotoxicity measured by maximum LDH release into supernatant collected after untreated cell freeze thaw.

