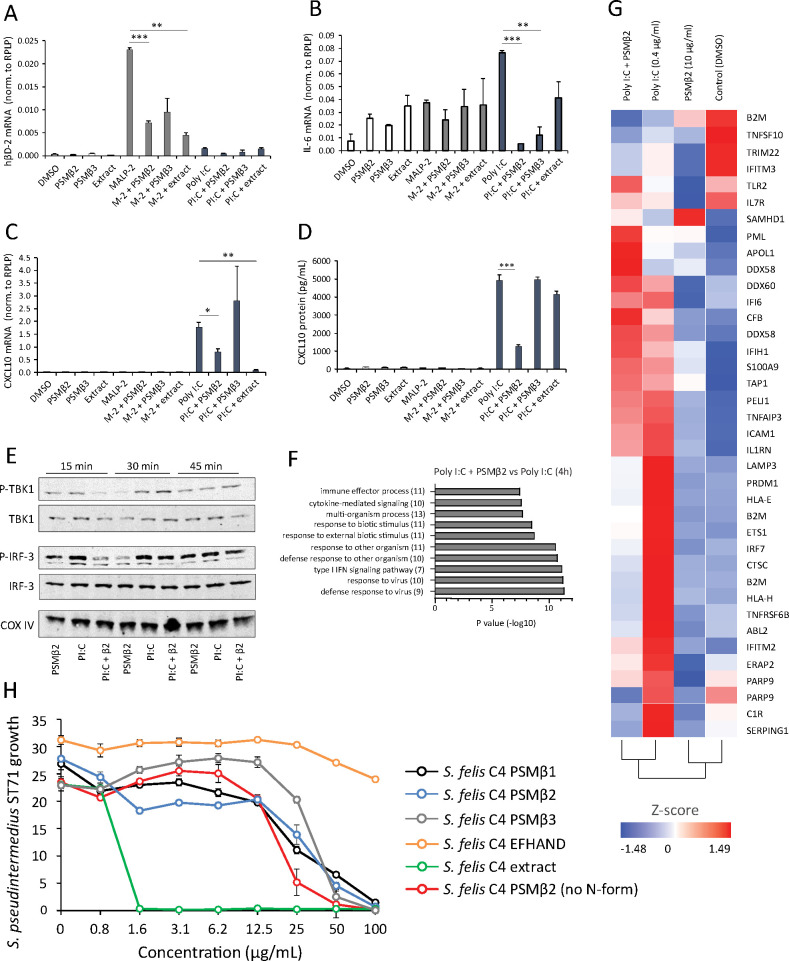
Figure 3. Antimicrobial S. felis C4 extract and PSMβ suppress TLR-mediated inflammation.
mRNA transcript abundance of hBD2 (A), IL-6 (B) and CXCL10 (C) as measured by qPCR in NHEKs stimulated with or without TLR2/6 agonist MALP-2 (M-2) (200 ng/ml) or TLR3 agonist Poly I:C (PI:C) (0.4 μg/ml) in the presence or absence of S. felis C4 extract, PSMβ2 or PSMβ3 (10 μg/ml) or DMSO control (0.1%) at 4 hr post-treatment. (D) Quantification of CXCL10 protein by ELISA from the supernatant of NHEKs stimulated with MALP-2 or Poly I:C in the presence or absence of S. felis extract, PSMβ2, PSMβ3 or DMSO control 24 hr post-treatment. (A–D) Error bars indicate SEM. One-way ANOVA with multiple corrections (Tukey’s correction) was performed. p values: * p < 0.05; ** p < 0.01; *** p < 0.001. (E) Time-course of the TLR3 signaling cascade by immunoblot of phosphorylated TBK1 (P-TBK1) and IRF-3 (P-IRF-3) proteins after stimulation of NHEKs with Poly I:C (PI:C), PSMβ2 (β2), or co-treatment with Poly I:C and PSMβ2 (PI:C+β2). (F) Gene ontology (GO) pathway analysis of genes downregulated in NHEKs after 4 hr co-treatment with Poly I:C and PSMβ2 versus treatment with Poly I:C alone. (G) Hierarchical clustering and Heatmap visualization of selected genes from GO enriched ‘immune response’ pathway (1.5-fold change) 4 hr post-treatment with DMSO, PSMβ2 or Poly I:C alone or with Poly I:C and PSMβ2 cotreatment. (H) Growth of S. pseudintermedius ST71 (OD600 nm) after 18 hr incubation with increasing concentrations of S. felis C4 extract, formylated peptides PSMβ1, PSMβ2, PSMβ3, EFHAND domain-containing peptide or non-formylated PSMβ2. Error bars indicate SEM. Representative of two independent experiments.


